Water systems are common in the chemical process industries (CPI). Mixing, heating, concentrating and evaporating water in these systems will often result in an accumulation of inorganic scale, which can markedly decrease process-system efficiency.
Scale inhibitors are chemical substances that, when added to industrial water at very low levels, act to reduce or prevent the formation of scale. Over the past several decades, the water treatment industry, as well as those applying its products, have been increasingly concerned about the environmental impact of scale inhibitors, along with that of other chemicals. The long list of available scale inhibitors includes several newer chemicals that are designed for biodegradability.
As the water treatment industry focuses on producing efficient scale-prevention products that minimize harm to the environment, practitioners in the CPI face questions about which scale inhibitors to use. As scale-inhibition products continue to improve in both areas, water users in the CPI must take into consideration the lowered environmental persistence of scale-inhibiting substances as well as their scale-inhibiting performance. Questions still remain about whether the new class of “green” products are effective scale inhibitors.
In hunting for biodegradable inhibitors, sometimes less-effective products are selected due to their perceived green qualities, despite the fact that lower efficacy may actually result in increased chemical discharge back to the environment. A poor inhibitor could potentially do more damage in the long run as larger volumes of additive are required to control the scale and, therefore, much larger volumes are discharged. A high degree of biodegradability is a worthy aim, but it should not be at the sacrifice of overall performance. In an ideal world, a very small amount of chemical would be used, and it would then disappear altogether. Although that target has not yet been reached, the industry is moving in the right direction. Tests are established for evaluating both inhibitor effectiveness and biodegradability, and they can help evaluate which available products reach closest to the ideal of high effectiveness and high biodegradability.
Scale inhibitors
Most common industrial processes, including petroleum production, mining, cooling water, desalination, reverse osmosis, pulp and paper manufacture, geothermal power production and sugar refining, operate using water systems. For various reasons, scale forms during operations, such as mixing, heating, concentrating and evaporating water. Scale accumulation can cause huge losses in production, increasing costs both financially and to the environment as systems become inefficient. For example, heat exchangers can become insulated by the scale and therefore cannot efficiently cool or heat.
Scale is formed by the increasing concentration of scaling cations, such as calcium and barium, as well as scaling anions, such as carbonate and sulfate. Once the concentration of ions exceeds super-saturation levels, nucleation will occur. Over time, nucleation leads to precipitation and the development of scale at the macroscopic level.
What happens at the surface of nascent crystals depends upon the relative rates of formation and dissolution of the scale. Generally the rate of formation is greater, thus leading to growth of the crystal. These small crystals can then clump together to form larger crystals, which will eventually block the system. Inhibitors can work to prevent the catastrophic buildup of scale at three separate stages: the nucleation stage, the growth stage and the deposition stage.
At the nucleation stage, threshhold inhibitors bind with scale-forming ions, but unlike chelants, the bound ions must be available to interact with their counterions. This disrupts the ion cluster at the early equilibrium stages of crystal formation, disrupting them before they reach the critical size for nucleation. As a result, the ions dissociate, releasing the inhibitor to repeat the process.
At the growth stage, growth inhibitors slow the growth of the scale by blocking the active edges of the crystal. Once the inhibitor has bound to the lattice, the crystal will form much more slowly and be distorted. Often they are more rounded in shape, which makes them less likely to adhere to surfaces and more easily be dispersed throughout the system.
At the deposition stage, dispersants prevent new crystals from coming together to form a large body of scale material. Dispersant-type inhibitors interact with the surface and repulse other charged particles to prevent binding.
A vast array of scale inhibitors is available today (Table 1), including phosphate esters and phosphonates, such as PBTC (phosphonobutane-1,2,4-tricarboxylic acid), ATMP (amino-trimethylene phosphonic acid) and HEDP (1-hydroxyethylidene-1,1-diphosphonic acid), polyacrylic acid (PAA), phosphinopolyacrylates (such as PPCA), polymaleic acids (PMA), maleic acid terpolymers (MAT), sulfonic acid copolymers, such as SPOCA (sulfonated phosphonocarboxylic acid), polyvinyl sulfonates. More recently, the so-called green inhibitors — polyaspartic acid (PASP), carboxy methyl inulins (CMI), polycarboxylic acids (PCA) and maleic acid polymers (MAP) — have become players.
| Table 1. Inherent biodegradability of commonly used scale inhibitors and the new ‘green’ inhibitors | ||
| Inhibitor Type | Acronym | Inherent biodegradability result* |
| Phosphonates | PBTC | 17% in 28 days |
| ATMP | 23% in 28 days | |
| HEDP | 33% in 28 days | |
| Polyacrylic acid | PAA | 10% in 35 days |
| Phosphinopolyacrylates | PPCA | 0% in 35 days |
| Polymaleic acid | PMA | 18% in 35 days |
| Maleic acid terpolymer | MAT | 35% in 35 days |
| Sulfonic acid co-polymers | SPOCA | 7% in 28 days (OECD 306) |
| Polyaspartate | PASP | 83–87% in 28 days |
| Carboxy methyl inulin | CMI | >20% (OECD 306) |
| Polycarboxylic acid | PCA | 68.6% in 28 days (OECD 306) |
| Maleic acid polymer | MAP | 54.9% in 35 days |
| * OECD 302B test unless otherwise stated. | ||
Biodegradation
Since the 1972 United Nations Conference on the Human Environment in Stockholm, Sweden, environmental pollution has been a major concern for all industries. Across the globe, a number of governments and regional economic integration organizations have since established programs for identifying and assessing substances that could cause longterm harm. Harm is defined as the undesirable effects resulting from the accumulation in living organisms of degradation-resistant substances above certain concentrations. These persistent organic pollutants (POPs) or persistent, bio-accumulating, toxic substances (PBTs) are identified, characterized and classified using a variety of tests and are subject to regulations concerning their use. These tests are dependent on the final destination of the chemical, and knowledge of how the environment will be impacted by its presence is paramount. The most harmful chemicals are generally those that remain within the environment, building up in the tissues of the biological organisms that inhabit the area until a toxic level is reached.
Biodegradation can be defined as the natural process by which organic substances are decomposed by microorganisms (mainly aerobic bacteria) into simpler substances, such as carbon dioxide, water and ammonia. Defining the degree of biodegradation is a consideration — complete degradation into these final simple components should be distinguished from partial degradation into a different related compound. Moving forward, industry will likely need an increasingly comprehensive body of knowledge about the biodegradation products resulting from a substance, its ability to bio-accumulate and its toxicity.
The biodegradability of some currently available inhibitors is shown in Table 1. Before the push for ‘green’ products, very few, if any, were actually biodegradable. With biodegradability above 30%, HEDP and MAT are just barely considered inherently biodegradable (will degrade eventually). Looking at the new generation of ‘green’ inhibitors, it is clear to see the difference. PASP is the most biodegradable, but all four products are well above the level required for the inherently biodegradable classification, as well as what is required to be considered a non-persistent chemical. Tests conducted by the author suggest that PCA and MAP offer a significant improvement over other biodegradable products such as PASP, and are also more efficient than their non-biodegradable counterparts against calcium carbonate scale.
OECD test categories
 |
For measuring biodegradability, the most recognized tests are the Organization for Economic Cooperation and Development (OECD) series, which demonstrate the susceptibility of a substance to microbial degradation under environmental conditions. The OECD biodegradation test series represents a variety of methods that include both purely laboratory-based tests, as well as simulation and field-based tests.
Since biodegradation is affected by many factors, each environment (such as seawater or freshwater) is very different. This causes a number of issues for method development. A trade-off exists between the closeness with which a test mimics the environment, and the reliability of the resulting data. As the tests more closely mimic the environment, the less control can be exerted, and the less reliable the data are. Figure 1 illustrates the continuum of laboratory tests versus those that simulate the actual environment.
In laboratory tests, biodegradation is encouraged with high levels of the test substance or a low substance-to-biomass ratio, and a simplified environment. Simulation tests are a good middle ground with regard to controlling external factors such as temperature and pH, but in a more realistic environment. This includes using a concentration of substrate that reflects its likely level when in use, as well as the use of indigenous biomass material to allow adsorption of the chemical onto the biomass. The test should also be conducted at a temperature typical for the environment it is designed to simulate. These are summarized in Table 2 and can be broken down into categories for the specific environments in which the substrate will be located. A series of tests can then be undertaken as follows:
| Table 2. Summary of OECD biodegradation tests and how they relate to the natural environment | |||||
| Soil | Aquatic sediments | Sewage treatment plants | Fresh water | Seawater | |
| Ultimate | 306 | ||||
| Ready | 301 A-E | 306 | |||
| Inherent | 304 A | 302 A | 302 B | ||
| Simulation | 307 B | 308 B | 303 A | ||
Ready/ultimate tests. These are rigid screening tests with a high level of test substance (2100 mg/L). Although they are laboratory tests, a positive result means that ultimate biodegradation in the environment will occur. A failure does not necessarily mean that the chemical will not biodegrade at all, so inherent biodegradability tests may be performed.
Inherent tests. These tests have a high capacity for degradation with long exposure times and a high biomass-to-substance ratio, thus giving the substrate the best chance to break down. Again, this is a laboratory test with a controlled and synthetic environment. A positive result will demonstrate that the substrate is inherently biodegradable, but a negative result can still not rule out eventual degradation in its final environment.
Simulation tests. These tests use a low concentration of the chemical and are performed in an environment that closely mimics the real world. A positive result here strongly suggests that a chemical will biodegrade in the natural environment. A negative result will give an indication that the chemical is likely to be persistent.
By following this process of beginning with the ready biodegradability tests and moving down the chain, a good understanding of how a substance will behave in the environment can be obtained. When this information is used in combination with the toxicity and bio-accumulation data, the impact of releasing this chemical into the environment can be assessed with a high degree of confidence. However, determining if a chemical biodegrades is only half the story, since all of this is futile if it is a poor inhibitor.
| Table 3. Calcium Carbonate Jar Test Water Chemistry | |
| Ion | Concentration, mg/L |
| Calcium | 150 |
| Magnesium | 45 |
| Sodium | 211 |
| Carbonate | 51 |
| Bicarbonate | 269 |
| Chloride | 397 |
| Total dissolved solids | 1,084 |
Testing inhibitor efficacy
In the industrial water treatment (IWT) area, the most commonly encountered type of scale is calcium carbonate, which may occur in three possible crystal forms — aragonite, calcite and vaterite. When testing for the efficiency of a scale inhibitor against calcium carbonate scale, the following tests can be performed.
1. The calcium carbonate jar test is a 30-min homogeneous test that demonstrates the threshold inhibitor ability of a product.
2. The pilot cooling-tower evaporative unit test is designed to test both the threshold and dynamic inhibitor mechanisms against calcium carbonate under heat transfer conditions.
 |
 |
 |
 |
 |
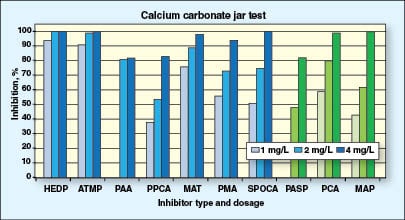
Calcium carbonate jar test. This test is designed to assess the ability of additives to inhibit the precipitation of calcium carbonate. The water chemistry simulates cooling water, and the high temperature represents heat-exchanger surface conditions. Air bubbling is used to facilitate carbon dioxide removal, which shifts the equilibrium toward carbonate formation. This shift increases the test severity by raising the pH of the test solution.
To carry out the test, a solution containing calcium chloride and magnesium chloride is mixed with an equal volume of a solution containing sodium carbonate and sodium bicarbonate and that already contains the additive to be tested. The air-bubbled solution is heated at 70°C (158°F) for 30 min, after which time the solution is filtered and the calcium remaining in solution is determined by EDTA (ethylenediaminetetraacetic acid) titration. The water chemistry for this test is presented in Table 3. The higher the amount of calcium retained in solution, the greater the scale inhibition ability of the product.
Figure 2 represents sample tests conducted by the author’s employer. The results are expressed as percentage inhibiton against dose level. At dose levels of 1 and 2 mg/L, HEDP and ATMP are clearly the most effective, with PCA and MAP being the best among the green scale inhibitors. Once a 4-mg/L dose level has been reached, a number of inhibitors are capable of 100% inhibition of calcium carbonate (PCA and MAP included), but PASP only reaches an 80% inhibition level. This may seem like a high figure, but unless 100% is reached, calcium carbonate will continue to form and ultimately reduce the efficiency of the plant significantly.
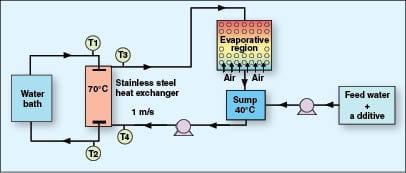
Pilot cooling-tower evaporative unit test. The evaporative unit test is a dynamic test designed to provide a realistic measure of an additive’s ability to control calcium carbonate deposition. The pilot cooling-tower evaporative unit has constant make-up but has no blowdown, so the system water concentration increases with time as evaporation occurs. The system water is circulated over a 316 stainless-steel heat exchanger. The heat exchanger is heated by passing hot water through the tube. The surface temperature of the heat exchanger is approximately 70°C (158°F). The evaporative region maintains bulk water temperature at 40°C (104°F) by passing air countercurrently to the water flow in the cooling tower. The higher the calcite saturation index (SI) that can be reached, the more efficient the inhibitor. The initial water chemistry for this test is given in Table 4 and a schematic diagram of the equipment used is given in Figure 3. Initial dose level of additives is 10 mg/L as solids.
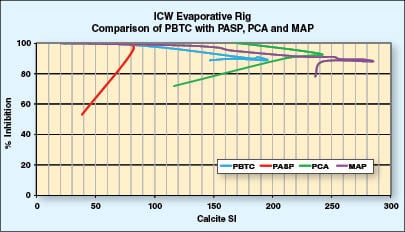
In Figure 4, PBTC shows what level a good calcium carbonate inhibitor can achieve in this test. Its failure point occurs at a calcite SI of approximately 200. According to data from the author’s company, MAP exhibited the best calcium carbonate control of the green inhibitors, reaching a calcite SI of 285. PCA also fared well, with a failure point at 240 calcite SI. Both of these results are a significant increase over that reached by PBTC. PASP, however, gave a rather poor result, failing at a calcite SI of approximately 80. This is less than one third of the level reached by MAP and PCA.
Both tests show that some green inhibitors can replace existing effective non-green inhibitors such as PBTC.
Petroleum-industry scale tests
When considering application scale inhibitor tests in petroleum fields, performing both the calcium carbonate and the barium-sulfate dynamic scale-loop tests is required to provide a good indication of inhibitor performance in the reservoir.
Calcium carbonate dynamic scale-loop test. In some ways, the dynamic scale-loop test is less severe than the threshold static jar test, because the inhibitor is replenished, so it maintains constant concentration. In the jar test, when a crystal is formed, some of the inhibitor is consumed as it binds onto the crystal surface. Because inhibitor levels are not replenished, concentration will drop over time. Having a constant inhibitor level throughout the dynamic test ensures that it is the growth-inhibition mechanism that is being studied, with metal surfaces acting as growth sites.
| Table 5. Calcium Carbonate Dynamic Scale-Loop Test Water Chemistry | |
| Ion | Concentration, mg/L |
| Calcium | 350 |
| Magnesium | 56 |
| Sodium | 10,077 |
| Potassium | 283 |
| Barium | 50 |
| Strontium | 50 |
| Bicarbonate | 1,000 |
| Chloride | 16,058 |
| Sulfate | 0 |
| Total dissolved solids | 27,924 |
| pH | 7.8 |
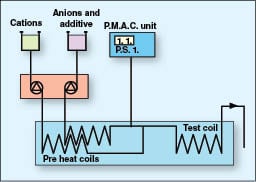
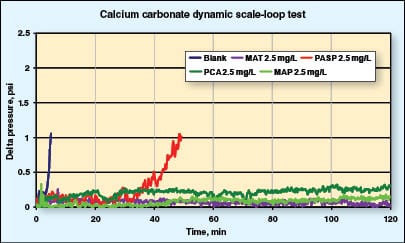
This test is conducted using synthetic water with the chemistry shown in Table 5. Separate solutions containing the anions and the cations are pumped through pre-heat coils at 90°C (194°F) and mixed in a T-piece prior to the 0.1-mm I.D., 1-m-long 316 stainless-steel test coil. A schematic representation of this apparatus is shown in Figure 5. During the test, calcium carbonate deposition reduces the bore of the test coil, causing an increase in pumping pressure. The rate of change in pressure across the coil is monitored with a pressure transducer and data captured. The test is considered successful if the change in pressure remains below 1 psi (6.9 kPa) over a two-hour period.
MAT, a commonly used inhibitor, demonstrates that a 2.5 mg/L dose level is sufficient to completely inhibit calcium carbonate scale formation. The green inhibitors PCA and MAP also display excellent scale inhibition at 2.5 mg/L. PASP is unable to prevent scale formation at this dose, reaching 1 psi (6.9 kPa) in only 50 min.
Barium sulfate dynamic scale-loop test. The water chemistry for this dynamic scale-loop test is given in Table 6 and is equivalent to a 80:20 troll-to-seawater mixture. The anion and cation solutions, this time with with no inhibitor present, are pumped through preheat coils at 90°C (194°F) and mixed in a T-piece prior to the 316 stainless-steel test coil, which has a 0.1 mm I.D. and is 1-m long. Barium sulfate deposition reduces the bore of the test coil, causing an increase in pumping pressure. Once a 1 psi (6.9 kPa) change in pressure has been achieved, a third solution containing anions plus inhibitor replaces the anion solution. The test is run for 2 h unless the additive fails to prevent further barium sulfate scale.
| Table 6. Barium Sulfate Test Water Chemistry | |
| Ion | Concentration, mg/L |
| Calcium | 636 |
| Magnesium | 634 |
| Sodium | 14,760 |
| Potassium | 446 |
| Barium | 120 |
| Strontium | 190 |
| Bicarbonate | 0 |
| Chloride | 26,930 |
| Sulfate | 530 |
| Total dissolved solids | 44,246 |
| pH | 5.5 |
Figure 6 illustrates the data for MAT and the three green inhibitors PASP, PCA and MAP. At a 4 mg/L dose level, MAT was able to stop deposition completely, thus leading to no further increase in pressure. PASP, PCA and MAP were equally efficient at this dose level, demonstrating that in this test, the green inhibitors are as efficient as those already in common use.
Edited by Scott Jenkins
Author

Kelly Harris is a senior scientist with BWA Water Additives Ltd. (2 Brightgate Way, Manchester M32 0TB U.K.; Phone: +44 161 8646699; Email: [email protected]; Website: www.wateradditives.com). She has previous industry experience with Fujifilm Imaging Colorants Ltd. where she worked on dye synthesis. In 2006, Harris joined BWA Water Additives working primarily on synthesizing and developing new scale and corrosion inhibitors for use in cooling waters, boiler water, oilfield applications, pulp and paper, geothermal, sugar, desalination and reverse osmosis systems. A number of papers and patents involving this work have been published or are in process. She received a Ph.D. in organic chemistry from the University of Bath, U.K. in 2004 for research on rhodium-catalyzed additions.