Be vigilant about parallel pumping conditions that can lead to catastrophic failures
During my career, I have seen several massive centrifugal pump failures caused by pump users attempting to operate pumps in parallel without the proper equipment review, procedural review or instrumentation. Parallel pump operation happens when two centrifugal pumps are installed side by side with common suction and discharge headers (Figures 1 and 2). In an ideal scenario, if both pumps have essentially identical head flow characteristics, then each pump should contribute equally to the total flow going into the discharge header, barring any unexpected line restrictions. However, problems often arise when operators assume that both that the pumps are identical in head, and that flow characteristics and flows will remain similar throughout the pumps’ lifetimes.
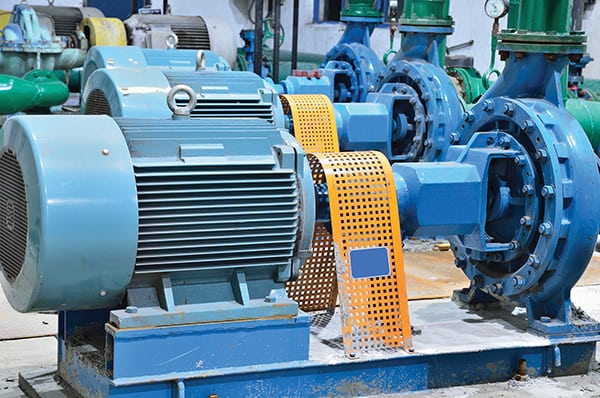
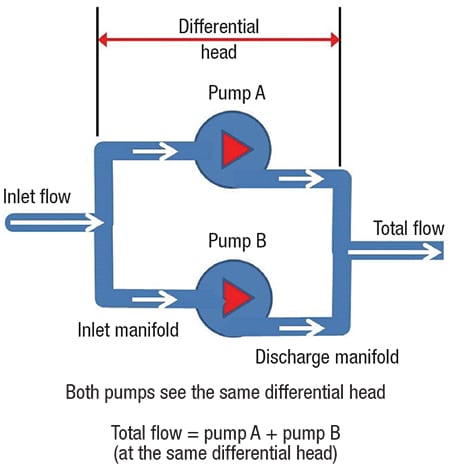
Figure 1. When parallel pumps are installed and operated in parallel, individual pump flows are additive, but pump heads are not. Problems often arise when operators assume the pumps are identical in head and flow characteristics and that flows will remain similar throughout the pumps’ lifetimes
Operating parallel pumps
Let’s look at a case (Figure 2) where, due to manufacturing and assembly differences, the first pump delivers 300 gal/min and the second pump delivers 315 gal/min. The total flow is 615 gal/min, which means that the first pump is delivering 48.8% of the total flow and the second pump is delivering 51.2% of the total flow.
If these pumps have best efficiency point (BEP) flows of 400 gal/min, then the first pump is running at 75% of its BEP flow, and the second pump is operating at 78.8% of its BEP flow. This example probably represents a typical situation in which pumps provide similar head flow characteristics to the job at hand.
When centrifugal pumps are operated in parallel, individual pump flows are additive, while pump heads are not. After studying Figure 3, the reader will surmise that, when operated in parallel, individual pump flows add to the right of the head-flow curves while the head that each pumps experiences remains the same. For example, as shown in Figure 3, at a value of about 288 ft of head, each pump delivers about 400 gal/min, yielding a total combined flow of 800 gal/min. Remember that this example assumes identical pumps are piped in parallel — which is rarely the case in the real world.
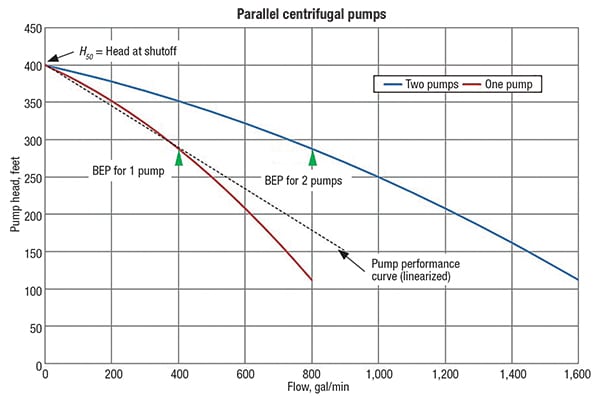
Figure 3. Shown here are performance curves where pump head is plotted against flow for a single centrifugal pump, and for two identical centrifugal pumps operating in parallel
Now, let’s look at a situation where one of the pumps operating in parallel has some wear. For example, Figure 4 shows the pump curves for a healthy and a worn pump on a single plot. For simplification, the pump curves have been linearized. As seen in Figure 4, the worn pump produces less head at all flows. As the wear becomes more and more severe, there will be a flow value where the healthy pump will completely overcome the worn pump and cause its flow to drop to zero.
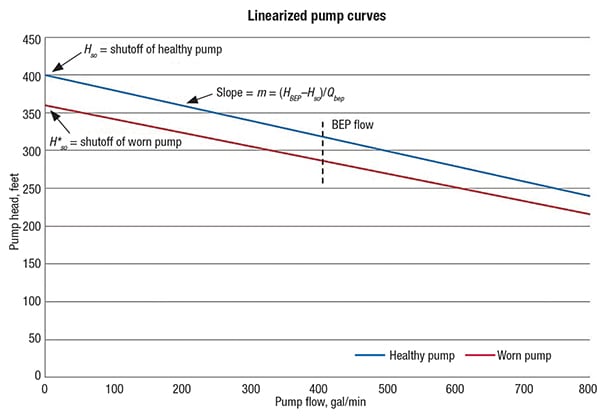
Figure 4. The blue line represents a linearized form of a healthy centrifugal pump curve, and the red line represents a linearized form of a pump curve for of a worn centrifugal pump
A zero-flow condition occurs because, even at shut-in flow conditions, the weaker pump can no longer generate sufficient head pressure to overcome the discharge header pressure and open its discharge check valve. It goes without saying that zero flow is very bad for centrifugal pumps.
It has been well-documented in the literature that operating centrifugal pumps at low-flow conditions relative to their BEP can lead to excessive vibration, pressure pulsations, accelerated bearing and seal wear, and rapid internal heating. We also know that prolonged operation of centrifugal pumps at very low or zero flow can lead to rapid catastrophic failures, which can result in expensive pump repairs, product releases and fires.
The pump-shutoff triangle
Looking at the upper left of the two curves in Figure 5, one can imagine a triangle comprised of the healthy pump curve, a horizontal line that intersects the pump head axis at the location of the worn pump shut-off head ( H so), and the pump head axis (the ordinate). The orange oval shown in Figure 5 highlights a closeup of the low-flow regions of the performance curves.
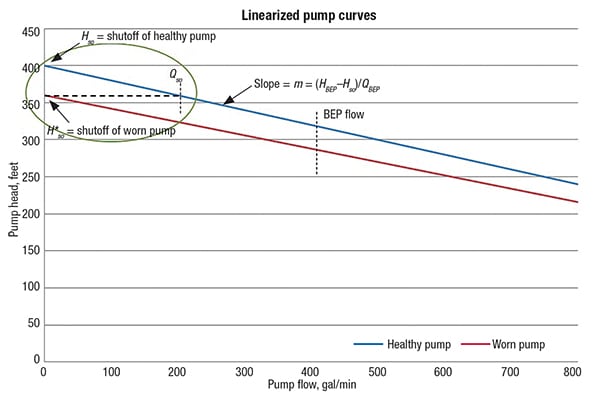
Figure 5. The “pump-shutoff triangle” is constructed using the linearized curve for the “healthy” centrifugal pump, the linearized pump curve for the “worn” pump and the ordinate
By observation, the slope of the healthy pump curve can be written as follows:
![]() (1)
(1)
Here we assume the pump curve is fairly flat and can be reasonably estimated by a straight line, where:
m = slope of the healthy pump’s head flow curve (linearized)
H BEP = Head at the best efficiency flow
H so = Head at shut-off
Q BEP = Flow at BEP
By inspection, we can write the following relationship to define the “pump shut-off triangle”:
![]() (2)
(2)
H * so = Head at shutoff of the degraded pump
Q so= Flow of the healthy pump that will produce the head required to shut off the degraded pump
Setting these two equations equal to the slope m, we arrive at the following:
![]() (3)
(3)
If we solve the new relationship for Q so /Q BEP we get:
 (4)
(4)
The term Q so /Q BEP is the flow ratio that will result in the shutoff of the degraded pump.
We will run through a few examples to better understand the value of this new equation.
Example 1. Let’s assume that one of the pumps is 100% healthy and the sister pump has degraded to the point where it is producing only 90% of its original head. After doing some research, you find that the ratio of the head at BEP and shut-off head ( H BEP /H so) is 0.8. If we plug this information into the Q so /Q BEP equation we get the following:
![]() (5)
(5)
The result means that for this set of conditions we can expect the “weaker” pump to experience a shutoff condition when the “healthier” pump reaches a flow of 50% of its BEP.
Example 2. Now, let’s assume that one of the pumps is 100% healthy and the sister pump has degraded to the point where it is producing only 95% of its original head. After doing some research, you determine that the ratio of the head at BEP and shutoff head ( H BEP /H so) is 0.85. If we plug this information into the Q so /Q BEP equation we get the following:
![]() (6)
(6)
In this example, we see that we can drop the flow on the “healthy” pump down to 33.3% of the BEP flow before a shutoff flow conditions is experienced.
Example 3. Finally, let’s assume that one of the pumps is 100% healthy and the sister pump has degraded to the point where it is producing only 95% of its original head. After doing some research, you find that the ratio of the head at BEP and shutoff head ( H BEP /H SO) is 0.7. The reader will notice that the Q SO /Q BEP ratio is much lower in this example, which means that this pump curve has a higher head rise to shutoff. If we plug this information into the Q so /Q BEP equation we get:
![]() (7)*
(7)*
Notice that when there is a larger head to rise to shutoff, a lower “healthy” pump flow can be tolerated before a shutoff condition is reached. The converse to this statement is that pumps with flat head-flow curves are much more sensitive to flow imbalance when internal wear occurs.
*Editor’s note: The value for HBEP/HSO is stated earlier as 0.7 and not as 0.75. When 0.7 is used in this equation, the value of QSO/QBEP is 0.167 and not 0.20
Recommendations
When multiple pumps are run in parallel, there is a very real likelihood of experiencing imbalanced flows during the course of their operation. Pump manufacturing differences, internal pump wear, large swings in process conditions, internal pluggage and asymmetrical piping designs can all contribute to unbalanced pump flows. No matter how hard you try, there will always be a possibility that a laggard pump could one day crash if performance degradation goes unnoticed before a shut-in condition occurs. The safest philosophy is to assume there will always be some level of pump flow imbalance, so operators should continuously monitor individual pump flows as a means of avoiding catastrophic low-flow conditions.
Here are some guidelines for designing parallel pump installations:
- Always try to install parallel pumps with similar head-flow characteristics. Running dissimilar pumps in parallel is asking for trouble
- Ensure that the associated pump piping is symmetrical so that flows are better balanced
- Never operate pumps in parallel that were not designed for such operation
- Parallel pumps should have dedicated flowmeters installed on each pump. Flowmeters installed to measure the total pump flow in parallel applications are useful for process control, but can mislead you into thinking that everything is normal. Each pump needs to have a healthy flow at all times
- Use flowmeters to provide low-flow shutdowns on each pump for protection. As a general rule of thumb, shutdowns can be set at about 30% of BEP flow
- Install flow-imbalance alarms on each pump to provide alerts about flow differences. Activate an alarm whenever a flow difference of greater than 10% between individual pump flows occurs
- Set low-flow alarms on each pump at 40 to 50% of BEP flow
- Designate one pump as the lead pump and one as the lagging pump, so that if flows are essentially equal and total flow drops for some reason, the lagging pump will be shut down and the lead pump will continue running
- Don’t be talked into using power meters or current meters to indicate flow. The relationship between power and flow varies based on the pump’s hydraulic design and may not provide an accurate indication of flow
- In variable-frequency drive (VFD) installations, always operate all of the pumps running in parallel at the same speed to ensure that they are generating approximately the same head
- A PLC (programmable logic controller) can be used to switch pumps off and on based on the current process demand, or to alert operators when pumps should be started or shut down based on the process requirements
The thoughtful design and careful installation of a parallel pumping system (Figure 6) will greatly increase the chances of reliable operation for years. Remember to train operators to treat parallel pumps with extra care and to keep an eye out for signs of early trouble, such as increased vibration or pressure pulsation levels. Plant personnel are the eyes and ears of your organization. n
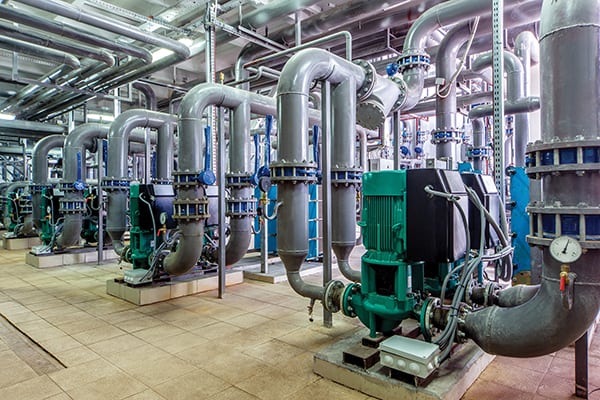
Figure 6. Centrifugal pump failures are often caused by pump users attempting to operate pumps in parallel without the proper equipment review, procedural review or instrumentation
References
1. Perez, Robert X., and Conkey, Andrew P., “Troubleshooting Rotating Machinery, Including Centrifugal Pumps and Compressors, Reciprocating Pumps, and Compressors, Fans, Steam Turbines, Electric Motors, and More,” Scrivener Publishing, 2016.
2. Perez, Robert X., and Lawhon, David W., “Operator’s Guide to General Purpose Steam Turbines,” Scrivener Publishing, 2016.
Author
 Robert X. Perez is currently employed by a pipeline company in San Antonio, Tex. (Email: [email protected]; Phone: 210-262-3298). He has more than 30 years of rotating equipment experience in the petrochemical industry. He earned a B.S.M.E. degree from Texas A&M University (College Station), a M.S.M.E. degree from the University of Texas at Austin, and is a licensed professional engineer in the state of Texas. Perez served as an adjunct professor at Texas A&M University-Corpus Christi, where he developed and taught the Engineering Technology Rotating Equipment course. Perez has authored four books (including Ref. 1 and 2), and coauthored four books in the field of machinery reliability. Perez has also written numerous machinery reliability articles for technical conferences and magazines.