This article provides guidance to the designer and operator of a safety-instrumented system (SIS), with an emphasis on conducting measurements. The use of best practices to ensure the strength of the overall system design, and the use of instrument diversity to combat common causes of failure, are covered briefly. Greater detail are provided on the use of new technologies — in particular, new smart-transmitter diagnostics and digital protocols, including wireless options.
Background
Best practice design of SIS has evolved over the past decade, prompted by the widespread adoption of the ANSI/ISA-S84.01-2004 Standard, which is itself based on IEC 61511. In their first article on this subject [ 1], the authors described how the new standard encourages a user to change from purely qualitative risk assessment to quantitative risk analysis. One benefit of the qualitative approach is that it is prescriptive and hence simpler to apply — the user is told what to do to achieve safety.
One potential downside is that the qualitative approach is designed to produce conservative results, which can result in over-design. The quantitative approach is more flexible — the user can use whatever approach minimizes lifecycle cost while still achieving the desired risk reduction. The designer must substitute quantitative data for qualitative descriptors; for example, a dangerous event previously described as “very likely” would now be assigned a probability of “0.1 events per year.” That article guided users through the process of finding these numbers. This was found to be a particular challenge for field devices such as sensors. What is the risk that a given transmitter might falsely report a safe condition? While suppliers can provide safety statistics that are “certified” by third parties, those data are typically derived from white papers or laboratory analysis. Is the actual risk greater in a “real world” installation? Might the risk be significantly different for two identical devices that are in different installations? How can the user quantify these “installed” risks?
The focus of a follow-up article by the authors [ 2] was on strategies for minimizing, rather than quantifying, identified risks. Since users commonly employ redundant sensors in critical applications, special attention was paid to identifying “common causes,”which can impact both sensors in a redundant system. For example, if a user has identified that impulse line plugging in a given installation might cause the pressure transmitter to falsely report a safe condition, rather than trying to quantify that risk, a better approach is to make the risk so small that it no longer has a material impact. The user was advised to employ a strategy that aimed to improve strength, diversity and diagnostics:
• Strength — Change the installation by shortening and widening the impulse lines so they don’t plug
• Diversity — Rather than using a second (redundant) differential pressure (dP) transmitter on a given orifice plate, use a vortex flowmeter. Choose a vortex design that is immune to the common cause of plugging
• Diagnostics — Select a transmitter that can detect that its lines are plugged
Best practices
To maximize the strength of an overall SIS design users should employ the same best practices that apply to any process measurement application, whether used for safety or for basic process control. Note that best practices tend to be specific to a given technology, and evolve over time with technological advances. Some examples of best practices with particular relevance to safety applications include ensuring that:
• The measurement uncertainty is smaller than the safety margin. For example, if a process is operated within 5% of where it becomes dangerous, the measurement must be much better than ±5%. This sounds obvious, but is often not the case. While tools and methodologies exist [ 3] to quantify measurement uncertainty, many users do not routinely employ these
• The thermowell is properly designed for the application. Poor thermowell design has been cited in the 1995 failure of the Monju fast-breeder reactor, which caused a spill of radioactive sodium [ 4]. Although no radiation was leaked to the environment, the reactor was not restarted until September 2010 — 15 years after the incident. New standards, such as ASME PTC 19.3-2010, significantly improve the reliability of wake-frequency calculations and minimize the risk of thermowell failure due to flow-induced vibration and transient effects
• The measurement is fast enough to detect the hazard. Speed of measurement response is affected by the device, the installation and application conditions. Again, few users go through the effort to quantify response time in a given application except when response time is known to be critical (for instance, for compressor anti-surge [ 5]). Similar effects are seen with temperature measurements, although there the sensor and thermowell dominate the overall response time
• Measure mass flow of gas and steam. Use a multivariable flowmeter that compensates for changing density, or measure mass flow directly using a Coriolis flowmeter
• In a top-down level measurement, significant changes in the vapor space are dynamically compensated. For example, a radar level meter used for drum level control must compensate for changing density of the steam in the boiler drum
• Proper materials are selected. This is key to avoid effects such as hydrogen permeation, or stress corrosion cracking in environments with high vibration or pressure cycling
To the greatest extent possible, the user should maximize the consistency of devices and practices between the measurements that are used for the safety system and the basic control system. While the use of a new, unfamiliar device or practice solely for safety applications may yield some benefit in theory, in practice the user is more likely to make an error during design or maintenance, due to lack of familiarity [ 6]. In addition, failure statistics gathered from basic process control installations can be leveraged for safety system design if those installations are consistent.
Employ diversity
Common causes of failure usually dominate safety risk in installations with redundant transmitters. Consider the case of a pressure or displacement-style level transmitter used to ensure that a vessel does not overflow. For these installations there are two main risks:
• The transmitter electronics will fail dangerously and provide the wrong output. Consider a case in which this probability of failure on demand (PFD) is 0.05, which means that if 20 transmitters are called on to shut the dangerous process down, one will fail to do so (Note: There are no units for PFD because it represents the probability that a safety system or component will fail to respond to a demand)
• The density of the fluid in the vessel will change, so the output of the transmitter does not reflect the true level. It may be reasonable to assume a PFD of 0.04 for this risk
PFDTotal = PFDTransmitter + PFDDensity= 0.05 + 0. 04 = 0.09
Making the device redundant: PFDTotal = (PFDTransmitter)2 + PFDDensity
=(0.05)2 + 0.04 ≈ 0.04
This is of course a simplified calculation, but it should be apparent that continuing to add redundancy — for instance, making the transmitter triply redundant — will yield little benefit, since the common cause of density variation will continue to dominate total system risk. Instead, the user should install a different (diverse) technology that is not affected by density variation.
Rather than trying to find a best practice to apply to a given technology, the user should consult a technology selection guide, widely available from technical societies such as the International Soc. of Automation (ISA). A truly objective guide avoids characterizing any given technology as “better or worse,” but, instead it identifies relative strengths and weaknesses of different technologies. For example, a level selection guide [ 7] should explain that radar-based level-measurement devices — both contacting and non-contacting — will be immune to variation in fluid density.
Such a description is not to suggest that radar is necessarily “better” than a level-monitoring device based on differential pressure (dP). It just suggests that radar is resistant to the identified common cause, and thus should be suitable as a backup to the chosen primary technology. Similarly, an advantage of dP-level measurement over radar-based options is that the former can ignore the effects of vessel internals that reduce the signal-to-noise ratio. For instance, reflections from agitators or baffles can increase noise and foam, or vapor can absorb radar energy and reduce signal strength. In an installation that relies on radar as the primary measurement technique, if the user identifies internal vessel effects as a significant common cause risk, then dP-level monitoring devices would be a suitable backup option.
Complementary strengths and weaknesses can be found in other measurement applications. For instance, in temperature measurement, RTDs are accurate and stable, while thermocouples are physically robust. In a waste-gas flow application, a Coriolis flowmeter provides higher turndown and is less affected by changing gas composition, while a dP-flowmeter is more stable in low gas pressures and introduces less permanent pressure loss. These guidelines evolve over time. Modern Coriolis meters can be sized to provide acceptable accuracy at lower pressure drops compared to older designs, and modern dP-flowmeters now offer higher overall turndown. For this reason, the user should use the most up-to-date technology selection guide.
Diagnostics improve safety
The most direct way for a user to obtain a “process diagnostic” is to add a measurement, or upgrade a switch to a transmitter. While a switch can freeze in position, a transmitter that fails in position can be detected by an alert operator. Even where the new transmitter is not connected to the safety system, a deviation between the new transmitter and the existing safety system transmitter can alert the user to a problem. Conversely, agreement between the two transmitters can help the user to justify extending the proof test interval.
Internal transmitter diagnostics became available with the earliest smart transmitters, and have become more sophisticated over time [ 8]. They can detect internal faults — for example, the microprocessor can discover that its non-volatile memory has become corrupted by an electrical or magnetic disturbance, or that an internal totalizer or cyclic counter has stopped updating. The safety benefit of these internal diagnostics are accounted for in the Failure Modes and Effects Diagnostic Analysis (FMEDA) safety data, which are provided by the supplier, and explains why newer transmitters provide superior safety statistics compared to older devices.
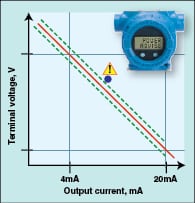
Some diagnostics require user activation. For example, diagnostics are available to detect power supply problems. A loop might be unable to reach an output higher than 18 mA because the power supply is browning out or cannot keep up with load from all the devices in the loop. Or, water might have leaked into the housing, causing an output shift. As shown in Figure 1, newer transmitters characterize the relationship between current draw and transmitter terminal voltage at commissioning, and alert the user during subsequent operation to changes that would indicate a problem. As with internal diagnostics, the safety benefit of power diagnostics are accounted for in the supplier’s safety data, with further improved transmitter safety statistics. An additional benefit of this diagnostic is that the user can eliminate the need for periodic manual proof testing of the loop’s high- and low-alarm limits.
Temperature transmitters are configurable to accept either thermocouple or resistance temperature detection (RTD) inputs. The transmitter obtains temperature from changes in voltage of the thermocouple, or changes in resistance of the RTD. This means that a transmitter connected to a thermocouple has unused resistance circuitry, which it can use to characterize “normal” resistance of the thermocouple and associated wiring, and alert the user to changes that indicate temperature-measurement errors and impending failure. Again, this improves safety, and can extend the schedule for temperature-sensor proof testing.
The most advanced smart transmitters contain microprocessors that read the sensor 20 times or more per second. While the logic solver or control system can only handle an “average” signal two or three times per second, the high-speed, unfiltered signal is useful for characterizing high-frequency process variability within that average.
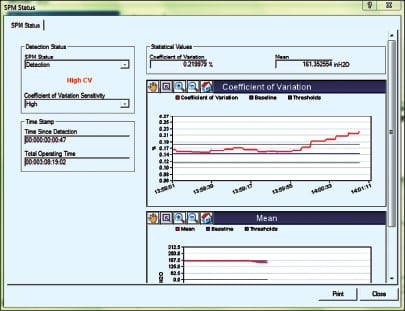
The meaning of a given increase or decrease in variability depends upon the process. For a pressure transmitter, a decrease in variability could indicate plugging of the sensing line or coating of the diaphragm seal. In a flow application, an increase in variability without a corresponding increase in mean — shown in Figure 2 — could signal that the liquid flow is becoming entrained with gas, or that the steam flow is becoming “wet” with liquid water. Either can cause measurement error, and also damage to mechanical components. In most temperature and level applications, the rate of change is limited by the physics of the process. A large, sudden change is not physically possible, and usually reflects some external influence like electrical noise. Rather than damping the signal, which slows response time to a genuine process upset, the smart transmitter will ignore the spike or dropout for a scan or two, holding the last value for the logic solver.
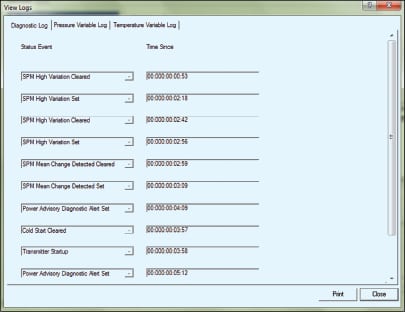
It’s not always obvious in advance how a change in variability should be interpreted. In practice, the user lets the diagnostics “learn” the process. If the process unit is upset — which may or may not engage the safety system — maintenance can later review the date-and-time stamped historical logs (essentially, the transmitter’s non-volatile “black box”) to see if any of the transmitters connected to the unit had observed a significant change in variability prior to the upset. As shown in Figure 3, review of the log might reveal that several minutes prior to the furnace flame blowout, pressure variability increased to “ x %”. Process engineering would confirm that this correlation makes sense — and is not just a coincidence — so the “furnace pressure variability greater than x %” warning could be used to prevent future blowouts.
To take credit for these process diagnostics, the user quantifies, in each application, the likelihood that the failure will occur, and the likelihood that the diagnostic will detect it. Values are derived from operating experience, in the same or similar applications. Until the user has gained experience with a given diagnostic, the user should operate the diagnostic in “open loop”, so that a diagnostic alert causes the operator to investigate further. That means that the diagnostic coverage must be de-rated to account for operator response time.
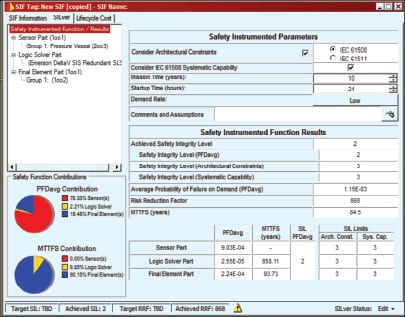
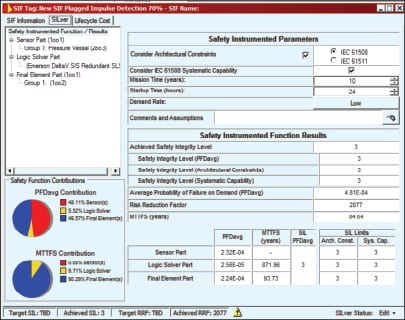
Once the user gains confidence that the diagnostic does not cause false alarms, the diagnostic can be turned “closed loop”, so that the transmitter output goes to the failsafe position when the condition is detected. Even then, with redundant transmitters a single alarm should not cause shutdown, but should alert the operator to investigate further. Figure 4 shows a safety analysis for a transmitter in an application with a risk of line plugging. The sensor contributes 78% of the probability of failure on demand (PFD), limiting risk reduction factor (RRF) to 868. Figure 5 shows the same analysis if the user implements a plugged-line detection diagnostic and takes credit for 70% coverage. RRF improves to 2077. Implementation of the diagnostic therefore significantly improves safety – from Safety Integrity Level (SIL) 2 to SIL 3 with no added hardware or proof testing.
Diagnostics — benefits
The most severe diagnostic condition is a “failed” status, which means the transmitter output can no longer be trusted, even if it remains onscale between 4 and 20 mA. The device that detects this type of failure immediately provides an offscale output — higher than 20 mA or lower than 4 mA, configurable by the user— to advise the logic solver that the process is operating dangerously.
Properly implemented, measurement diagnostics provide additional benefits. First, the user can be alerted to lower levels of severity preceding “failed.” A “maintenance required” status informs the user that the measurement, while probably correct now, will eventually become invalid — and cause a failure — unless the user performs some remedial action. Many failures develop gradually, so the user can be informed of an “impulse line starting to plug,” a “thermowell starting to coat,” or a “power supply starting to brown out.” The “water in terminals” diagnostic signals small amounts of condensate that cause a measurement shift, but if ignored will eventually — in weeks or months — cause corrosion through the terminals and device failure. A downward trending signal-to-noise ratio for a radar level meter indicates that the antenna of the meter is gradually becoming coated by condensing fluids in the process. If ignored, the signal will eventually become unusable, and the transmitter will report a “failed” condition. The diagnostic allows the user to ignore the antenna until and unless alerted to the need for cleaning. This predictive maintenance has dual benefits — it eliminates routine inspections for reduced maintenance cost, and prevents future failures for higher uptime.
Failure diagnostics force a potentially dangerous process to shut down and so are valuable by themselves. Predictive maintenance diagnostics are most useful when promptly and clearly communicated to maintenance personnel, and logged in a historical record. This requires enabling technologies in addition to the device diagnostics themselves — asset management systems and digital communication protocols.
A centralized asset-management system (AMS) is useful for several reasons. First, it provides early warning of impending failures in remote field devices, so maintenance can remedy the problem before it causes failure. Second, for devices that do fail, a detailed description of the failure and context-sensitive remedial action can speed trouble-shooting. Finally, regular use of the AMS helps to ensure consistency, for routine maintenance and proof tests and the collection of failure statistics.
It was explained earlier that a key challenge in safety system design is obtaining relevant data. The AMS automatically collects failure statistics for all connected devices, allowing the user to quantify the probability of specific failures under actual operating applications and conditions. So the user can better estimate risks of specific real-world interface failures, including those previously referenced (line plugging, RTD breakage, antenna coating and so on) This also applies to time-based conditions — if the as-found/as-left audit trail shows that a device did not require any maintenance during the last few proof tests, the user can better justify extending proof test intervals.
Digital communications
A digital communications protocol allows the user to communicate additional information from the transmitter, including diagnostic information, to the AMS, without additional wiring. Users tend to prefer open standards, which ensure access to competitive pricing and best-in-class technology, and minimize the risk of obsolescence. Although all-digital Fieldbus protocols such as Foundation Fieldbus and Profibus PA are widely used in basic process control, they have not seen adoption in process-industry safety systems beyond small demonstrations.
This is probably because the key benefit of the all-digital protocols — multi-drop capability to reduce wiring cost —is not realized in safety applications [ 9]. Combining process and safety applications, fieldbus transmitters account for a growing, but still small mix of new device installations. The vast and growing majority — nearly 75% of new transmitters shipped in 2011 — use HART [ 10].
HART is a “hybrid” protocol, communicating diagnostics and other information in a digital stream superimposed at 1,200 Hz on a 4-20-mA analog signal. Newer control systems and logic solvers can use both signals at the same time — the analog signal for control and safety, and the two-way digital HART information for configuration and diagnostics. An older logic solver can also use a HART transmitter, because it simply filters out and ignores the high frequency HART noise while using the analog signal. To obtain the information in the digital stream, many users have installed “HART multiplexers”, which strip off the HART information and send it to a parallel AMS.
Not surprisingly, since it leverages existing supplier and user experience, the dominant protocol for wireless transmitters is WirelessHART, also referred to as IEC-62591 [ 11]. Like wired HART, WirelessHART allows users to add new transmitters for improved process visibility, plus provide access to complete diagnostic information from existing or new transmitters, from any supplier, for any control system or logic solver. Better, it minimizes cost and physical space, in both green and crowded brownfield installations, by eliminating the need for new infrastructure — wires, junction boxes, multi-conductor cables, conduit and wire trays, marshalling cabinets and logic solver input cards, racks and power supplies.
WirelessHART uses a self-organizing mesh (Figure 6). Each transmitter contains a smart radio frequency (RF) radio. While RF is a line-of-sight technology, it can work through some walls and gratings, and around smaller pipes and motors. In a mesh network, some devices can communicate directly with the gateway, and some devices can only see other devices. A data packet will “multi-hop” as necessary until it gets back to the gateway.
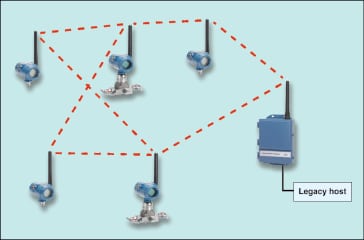
Once the system reaches sufficient density, the user can usually assume that any new device will be able to communicate with several other devices, so failure of any one device will not affect network reliability. The network is self-organizing, meaning that each device automatically forms multiple connections to the gateway, which re-form dynamically as new devices and obstacles appear. This ensures high reliability with minimal engineering, and avoids costly site surveys.
As shown in Figure 7, the wireless signals are not used directly by the safety system. New or existing safety system transmitters connect into the logic solver via traditional HART/4-20-mA wiring. When the legacy logic solver does not support HART input, diagnostic information can be communicated in parallel to the AMS using smart antennas. Additional “process visibility” transmitters needed to improve availability, compliance and efficiency communicate wirelessly to both the basic process control system and the AMS, and the user can choose to compare these new wireless transmitters to the wired safety-system transmitters to improve diagnostic coverage. Installation costs are minimized when the devices are battery powered, though the need to install and maintain devices in hazardous areas limits battery capacity. Although devices can be configured to communicate every second, with current battery and radio technology users are achieving 3- to 10-year battery lives with 4- to 30-second update rates.
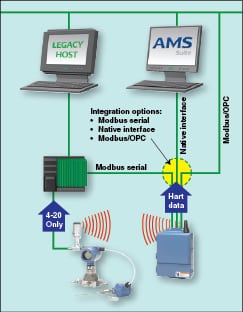 |
| Figure 7. Process variables are communicated using traditional 4-20-mA connections to the logic solver, while diagnostic information travels via the WirelessHART to the maintenance terminal |
Security is important because wireless data and devices can be accessed from outside the plant fence, bypassing the usual plant security. All data should be sent with encryption, so someone listening in will not be able to decode the message and steal the data. Related is authentication/verification — only valid devices, and not hackers, can gain access to the system. Finally, even the most secure design can be defeated by poor password/code management — human error. To add a new device to the network, the user manually inputs the network name and “join key” using the familiar HART handheld, but only the system-generated, encrypted rotating key is broadcast over the network.
Wrapping up
The safety system designer’s first approach to minimize risk should be to improve strength through best practices. What cannot be eliminated should be avoided via a diverse technology that is resistant to common cause failures. What remains should be diagnosed, using a combination of new wired and wireless measurements, and device diagnostics. Diagnostics are available to detect problems in the device, wiring, process connections and in the process itself. For maximum benefit, information should reach operators and maintenance personnel in real-time, with context-sensitive remedial action. Logging all diagnostics and maintenance action from a central asset management system will ensure consistency, and simplify collection of failure statistics. Historically, users used multiplexers to obtain this diagnostic information. Open protocols such as WirelessHART now provide the same benefits at a much lower installed cost.
References
1. Brown, S., Menezes, M., Design Safety Instrumented Systems with Relevant Data, Chem. Eng., pp. 54–58, July 2003.
2. Brown, S., Menezes, M., Measurement Best Practices for Safety Instrumented Systems, Chem. Eng., pp. 66–72, Sept 2006.
3. Menezes, M., When Your Plus and Minus Doesn’t Add Up, Flow Control, January 2005.
4. Pollack, A., Reactor Accident in Japan Imperils Nuclear Program, Feb 24, 1996, New York Times, p. A-1.
5. Menezes, M., Improve Compressor Safety & Efficiency with the Right Pressure Transmitters, Control Solutions, November 2001.
6. Fox, A. and Patterson, D., Self-Repairing Computers, Sci. Am., June 2003.
7. Liptak, B., “Process Measurement and Analysis,” CRC Press, 2003.
8. Menezes, M., Improve Plant Safety Through Advanced Measurement Diagnostics, Chem. Eng., October 2000.
9. Welander, P., Safety on Fieldbus, Control Eng., June 2009.
10. “2010 Pressure Transmitter Worldwide Outlook Study,”ARC Advisory Group, USA.
11. Boyes, Walt, All Quiet on the Wireless Front, Control, August 2011, p. 30.
Authors

Stephen Brown is a senior safety and control systems engineer with E.I. du Pont Nemours & Co. (Phone: 304-863-4727; Email: [email protected]). He has 23 years of experience in control and safety systems and has been involved with the ISA84 Committee. Brown holds a degree in electrical engineering from Carnegie Mellon University.

Mark Menezes manages Emerson’s measurement business in Canada (1421 Samuelson Circle, Mississauga Ont., Canada L5N 7Z2; Phone: 416-459-5935; Email: [email protected].). He holds a B.S.Ch.E. from the University of Toronto, and an MBA from York-Schulich University in Toronto. Menezes has 22 years of experience in industrial automation, specializing in control systems, loop controllers and flow measurement.