Dilute-phase pneumatic conveying systems must be operated in a certain sequence and have sufficient instrumentation and operating controls to assure reliable operation and prevent problems. This article discusses two subjects that are important for successful dilute-phase conveying. Discussed below are design guidelines for instrumentation and controls that can prevent operating problems, such as pipeline plugging, downtime, equipment failure, high power consumption, product contamination and more. The article also provides a simple methodology for finding out if the presently used conveying velocity is too low or two high and for making the required changes in this velocity.
The required instrumentation depends on the degree of automation that is necessary, and whether the system is to be controlled locally or remotely. When manual control of the conveying system is used, problems can arise, especially if the operators do not have a thorough understanding of the design and of the required operating method of the conveying system, or if they do not pay close attention to day-to-day operation of the system. For conveying systems — where even a single error can result in a large financial loss — a well-instrumented and automated control system is highly recommended.
Process logic description
Feeding solids into a conveying line that does not have an airflow with sufficiently high conveying velocity will result in plugging of the line. To prevent this, solids must be fed into the conveying line only after the required airflow has been fully established. This requirement is met by allowing the solids feeder to start only after the blower has been running for at least five minutes. To do this, the rotary-valve motor should be interlocked with the blower motor so that the blower motor has run for five minutes before the rotary-valve motor can start.
When the conveying system is running, the rotary-valve motor must stop immediately in the event that the blower motor stops for any reason. If the rotary valve is not stopped, solids feed will continue and will plug the pipeline below the feeder. To remove this plug, the pipeline will need to be opened. This required control option is implemented by interlocking the rotary-valve motor with the blower motor so that the rotary-valve motor stops when the blower motor stops.
Should the conveying system need to be stopped, certain steps must be followed: The first step is to stop the solids feed, after which the blower is allowed to run until the conveying line is empty and the blower discharge pressure has come down to the empty-line pressure drop. Do not stop the blower and the solids feed at the same time.
When a conveying cycle has been completed and the solids flow into the conveying line has been stopped, the blower motor must continue to run for at least a few more minutes to ensure that all of the solids that are still inside the conveying line have been conveyed to the destination bin. If these solids are allowed to remain in the conveying line, they may plug the line when the system is restarted. These solids may also cause contamination if a different solid is conveyed in the next cycle.
Solids feed must stop immediately if the normal operating pressure of the blower increases by 10% and continues to rise. This is because the pressure increase is most likely due to the conveying line starting to plug. If the ongoing feed stream is not stopped, the pressure will keep increasing, making the plugging situation worse.
After stopping the feed, the blower is allowed to run for about five minutes in an effort to flush the plug. If the plug does not flush out and the blower pressure remains high, the blower motor should be stopped. The plug is then removed by tapping the pipeline to find the plug location and opening up the plugged section of the pipeline.
Solids feed must also be stopped if the receiving bin or silo becomes full, as indicated by its high-level light and alarm. If the feed is continued, the bin will overfill and the solids will back up into the conveying line, causing pluggage.
If a conveying line has diverter valves, the position of the diverter valves must be set up in a “through” mode or in a “divert” mode before starting the blower and the solids feed. If the destination bin or silo is changed for the next conveying cycle, the diverter valves position must be changed before the conveying blower and the rotary valve are started.
Graphic control panel. In the central control room, a graphic panel (Figure 1) should be provided to show a schematic diagram of the conveying system, starting from the air supply blower to the receiving bins or silos. This panel should have the following lights:
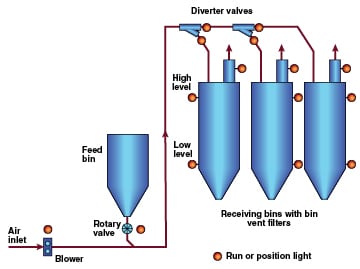
• Run lights to indicate the operaing status of the blower motor and the rotary-valve motor
• Position lights to indicate the divert or through position of the diverter valves
• Position lights to indicate the low and high levels in the receiving bin or silos
• Run lights to show the operating status of the bin vent filters/dust collectors
Figure 1 shows in one glance how the conveying system has been set up, and the operating status of all components of the system.
Monitoring conveying air pressure. Conveying pressure is a key parameter in pneumatic conveying systems. It must be regularly monitored from the control room as well as locally at the blower. For measurement of the conveying pressure, a locally mounted pressure indicator should be provided at the blower discharge. If the blower is located far away from the rotary valve, a second pressure indicator should be provided just upstream of the rotary valve.
These two measurements will show the overall pressure being provided by the blower, and the pressure drop in the conveying line. In addition to local pressure indicators, these pressure measurements should also be provided in the control room using pressure transmitters.
Digital pressure indicators are better than the analog type, because they can show the pressure much more accurately, up to two decimal points. These pressure measurements should be archived on the computer so that historical data are available if needed in the future. An alarm for high blower-discharge pressure should also be provided in the control room.
Monitoring blower discharge air temperature. A locally mounted temperature indicator should be provided at the blower discharge, and also at the blower after-cooler discharge if an air cooler is used. This temperature is needed to carry out calculations for the “as-built” conveying system. If this air temperature can affect the conveying characteristics of solids being conveyed, it must be monitored closely.
Rotary-valve motor interlocks with the blower motor. A manually adjustable timer with a selector switch should be provided in the control room to provide three functions: 1) Automatically stop the rotary valve if the conveying pressure starts to increase (indicating start of formation of a line plug); 2) Allow the blower motor to continue to run for the selected time, such as 10 to 15 minutes (in an effort to clear the line plug); and 3) Restart the rotary-valve motor if the conveying pressure falls to the normal pressure.
Diverter valves. Position lights are provided in the control room graphic panel to indicate if the valves are in the “through” or “divert” position.
Receiving bins. Low- and high-level lights are provided in the graphic panel for the receiving bins. An alarm should be provided in the control room to indicate high level in the bins. At the high level, the rotary valve motor should be stopped automatically.
Bin vent filters/dust collectors. The bin vent filters or the dust collectors on the bin vents must be running before the conveying system is started. A “run” light for the filter should be provided in the graphic panel.
Pressure drop indicators should be installed locally to show the pressure drop across the filter elements. Their locations should be easily accessible to the operating staff. For conveying materials that have high dust loading, alarms for low- and high-pressure drops should be provided in the control room. The low-pressure drop alarm would indicate a ruptured filter element, and the high pressure drop alarm would indicate a completely clogged filter element.
Instrumentation checklist
A summary of the instrumentation requirements, as described above, is provided below:
For the blower:
• Local and control room mounted running lights for the blower motor
• Local pressure indicator at the blower discharge
• Local temperature indicator at the blower discharge
• Local temperature indicator at the blower after-cooler discharge, for applications using a cooler
• Pressure transmitter at the blower discharge with a pressure indicator in the control-room control panel. Computer storage of pressure data
• Control room alarm for high blower discharge pressure
• Blower motor interlocks with the rotary-valve motor
For the rotary valve:
• Local and control-room-mounted running lights for rotary valve motor
• Control-room-located, manually adjustable timer for starting and stopping the rotary valve motor
• Interlocks with the blower motor
For the diverter valves:
• Position lights to indicate “through” and “divert” positions
• Hand switches for control room operation of valve positions
Receiving bin:
• Low-level and high-level switches with indicating lights for the receiving bins
• Control room alarm to indicate high level in the bin
Bin vent filters/dust collectors:
• Running lights for the bin vent filters or dust collectors
• Local pressure-drop indicator
• Alarms for low- and high-pressure drop across filter elements (optional)
Graphic control panel:
• Graphic panel showing the conveying system route with run lights for the blower motor and rotary valve motor, position lights for the diverter valves, low- and high-level lights for the receiving bins, and run lights for the bin-vent filters
Finding the conveying velocity
Along with conveying pressure, conveying velocity is perhaps the most important variable in pneumatic conveying. After a conveying system has been installed and is going through startup, its conveying velocity should be checked to make sure it is not too low or too high, and is about equal to the conveying velocity that is required. If the conveying velocity is too low, it may cause line plugging problems; if it is too high, it will result in higher particle attrition, pipeline wear, and higher energy usage.
The conveying velocity used in the conveying system’s design calculations may be too low or too high because it is difficult to find a reliable method to determine its correct value. This value depends upon many variables, such as solids particle size, bulk-solids density, solids-to-air ratio, air density, pipeline diameter and others. Presently, there are two methods to find the conveying velocity. The first method is to use equations to calculate saltation velocity (the gas velocity at which particles will fall out of the gas stream). These equations have been developed by researchers to find the impact of the above-mentioned variables on saltation velocity. As they are based on research work that is carried out in small-scale test equipment in a laboratory, they do not cover the entire range of solids and all of their properties. These equations can be found in published books and literature.
Th second method is to use conveying velocity values that are available in published literature such as those given in Table 1. It should be noted that these published values are applicable to only those pneumatic conveying systems from which they were derived, but may or may not be applicable for new conveying systems. This is because the conveying velocity for a particular conveying system depends on the values of various factors and variables such as solids particle size, particle size distribution, particle density, air density, solids conveying rate, pipeline diameter and more. As shown in Table 1, the published values may not be applicable because they do not give any information on the values of the variables on which they are based.
| TABLE 1. COMMONLY USED CONVEYING VELOCITIES | |||
| Material | Conveying velocity, ft/min | Material | Conveying velocity, ft/min |
| Alum | 5,100 | Malt, barley | 3,300 |
| Alumina | 3,600 | Oats, whole | 4,200 |
| Bentonite | 3,600 | Nylon, flake | 4,200 |
| Bran | 4,200 | Paper, chopped | 4,500 |
| Calcium carbonate | 3,900 | Polyethylene pellets | 4,200 |
| Clay | 3,600 | Polyvinylchloride, powder | 3,600 |
| Coffee beans | 3,000 | Rice | 4,800 |
| Coke, petroleum | 4,500 | Rubber pellets | 5,900 |
| Corn grits | 4,200 | Salt cake | 5,000 |
| Corn, shelled | 3,300 | Salt, table | 5,400 |
| Diatomaceous earth | 3,600 | Sand | 6,000 |
| Dolomite | 5,100 | Soda ash, light | 3,900 |
| Feldspar | 5,100 | Starch | 3,300 |
| Fluor (wheat) | 3,600 | Sugar, granulated | 3,600 |
| Flourspar | 5,100 | Trisodium phosphate | 4,500 |
| Lime,hydrate | 2,400 | Wheat | 3,300 |
| Lime, pebble | 4,200 | Wood flour | 4,000 |
A proposed method
This third method is based on running a test on the as-designed and built conveying system to determine the true value of the solids saltation velocity. The value of the saltation velocity obtained by the test will be accurate because it is based on the properties of the solids being conveyed and on the as-designed and built conveying system. This value is then used to determine the value of the conveying velocity.
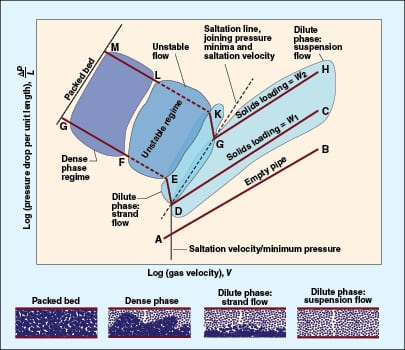
This test requires gradually reducing the airflow that goes into the conveying line so that the conveying velocity continues to decrease until it reaches saltation conditions. The Zenz diagram (Figure 2) shows both the dilute- and dense-phase conveying regimes, and the saltation velocity interface between them. As shown, the conveying pressure is at a minimum at the saltation velocity. In the test, the airflow and hence the conveying velocity is reduced until this minimum pressure point is reached, after which the pressure starts to increase.
The equipment required for this test is shown in Figure 3. A vent line is installed in the air-supply line at the discharge of the blower. Its purpose is to vent off to the atmosphere some of the conveying air that is being supplied by the blower. In this vent line, a flow-control valve with a flow indicator is used to control the airflow that is to be vented out. The airflow that is vented out is then subtracted from the air supplied by the blower to determine the airflow going to the conveying line. The conveying velocity is then calculated based on this airflow and pipeline diameter.
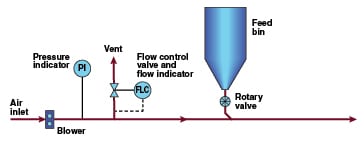
To run this test, the conveying system is started and run at full capacity for a few minutes to bring it to steady-state conditions. Keeping the solids flowrate constant, the vent valve is manually and gradually opened to start ventinga few cubic feet per minute of the conveying air, reducing the conveying airflow and the conveying velocity.
A close watch is kept on the discharge-pressure indicator installed at the blower outlet. This pressure will keep falling with the decrease in airflow, but as shown in Figure 2, its value will eventually reach a point after which it will start to increase. The objective of the test is to find the airflow at that point. The vent airflow is gradually increased until this point is reached and the pressure, instead of falling, starts to increase. This is the minimum pressure point beyond which the conveying system migrates to dense-phase conveying. At this point, the solids reach their saltation velocity.
The saltation velocity value obtained by the test is increased by a safety factor of about 30% to select an appropriate value for the conveying velocity. Solids velocity always decreases when solids flow through a bend. This decrease can be 5 to 20% depending on the properties of the solid being conveyed. Unless the conveying velocity is high enough, such a decrease can result in saltation of the solids and plugging of the bend or its downstream conveying line.
This test-derived optimum conveying velocity is compared with the velocity that is actually being used. If the actual velocity currently in use is lower, then the blower speed is increased to match the optimum conveying velocity; if it is higher, then the blower speed is decreased. The change in speed is determined from the blower performance curve. The speed change is implemented by changing the belts and sheaves of the blower.
Author

Amrit Agarwal is a consulting engineer with Pneumatic Conveying Consulting (7 Carriage Rd., Charleston, WV 25314; Email: [email protected]). He retired from The Dow Chemical Co. in 2002, where he worked as a resident pneumatic-conveying and solids-handling specialist. Agarwal has more than 40 years of design, construction, operating and troubleshooting experience in pneumatic conveying and bulk-solids-handling processes. He holds an M.S. in mechanical engineering from the University of Wisconsin, Madison, and an MBA from Marshall University (Huntington, W. Va.). He has written a large number of articles and given classes on pneumatic conveying and bulk solids handling.