Chemical manufacturers are using advanced analytics solutions to transform the way their employees solve data-intensive optimization problems
The traditional approach to process-data analysis for optimization has been on-premises process data historian integration with a Microsoft Excel add-in. This methodology requires users to re-query each source system for the event they want to investigate, and to repeat this step over each new time range.
On-premises data sources lack interconnectivity to other data sources, need on-site administration, and require users to be connected to the company network. This rigid architecture means data and analytics have a hard time leaving the literal and metaphorical plant walls, preventing cross-site benchmarking and making a broader organizational analytics strategy infeasible.
However, the past few years have brought tremendous advancements in industry 4.0 technologies, particularly with regard to the democratization of data analytics.
Advanced, cloud-based analytics applications have evoked a paradigm shift in the way engineers think about process optimization and solving other problems involving large amounts of data.
To maintain profitability while addressing environmental and sustainability concerns, the chemical process industries (CPI) must transition its data management and associated analytics capabilities. An early stepping stone in this process is leaning into the cloud as a resource. Embracing the cloud does not mean that a company must migrate all of their existing on-premises data prior to advancing to the next step. They can ease into cloud-based offerings by selecting a cloud-native data-analytics platform that will connect to their data wherever it is currently stored, and where it is going to be stored in the future, as part of their longer-term data strategy. Cloud analytics applications dramatically reduce the time to implement new software solutions and get them into the hands of the end users while improving calculation performance by throttling resources and ultimately reducing information technology (IT) infrastructure and maintenance costs. Cloud-based advanced analytics applications cater to the needs of many user personas with a point-and-click user interface for performing descriptive, diagnostic, predictive, and prescriptive analytics.
The following use cases highlight these evolving methodologies — both for solving difficult problems more efficiently, and for exploring challenges outside the capabilities of legacy analytics tools.
Product run-length optimization
Process effects like fouling or catalyst degradation can cause production rates to become constrained over the course of a product run. These constraints can often be removed by shutting down to perform equipment maintenance, or by performing an online procedure to remove process fouling or plugging. The tradeoffs for performing one of these maintenance procedures can include downtime, rate reductions and quality losses. Evaluating when it makes sense to proactively perform one of these procedures quickly becomes a complex multivariate optimization problem. The goal is to meet production targets in the shortest possible amount of time, which requires additional equipment availability and higher throughput capacity.
Solving this type of advanced optimization problem has historically required expertise in advanced statistical-modeling software and computer programming languages. Drawbacks to these approaches are models are built on static data, are very difficult to deploy and require a long time for retraining with updated process data.
The best deployment option for process modeling is a solution with a live connection to the data source. This is a necessity to ensure that the model can be used in near-realtime applications, with the model continuing to learn and improve based on recent data.
One chemical company was experiencing a degrading production rate over time due to a buildup of polymer skins on the walls of a tubular reactor. This was restricting flow and increasing the pressure delta, causing it to approach the design limits of upstream equipment.
The company ran at ever-degrading rates until equipment limitations forced them to execute an online procedure that would restore production rates to near the previous maximum, resulting in a few hours of off-specification production. They used Seeq’s analytics platform to evaluate this base-case operation against the alternative of proactively performing the defouling procedure to regain throughput capacity.
The advanced analytics application was used to calculate the number of defouling/fouling cycles that would minimize the total production time for a given order quantity. With the optimal number of cycles identified, a predicted degradation rate was calculated and used to build a “golden” profile of the future fouling (running) cycles (Figure 1). As the run progressed, actual production data was compared to the forecast profile to compare performance against the best-case fulfillment date.
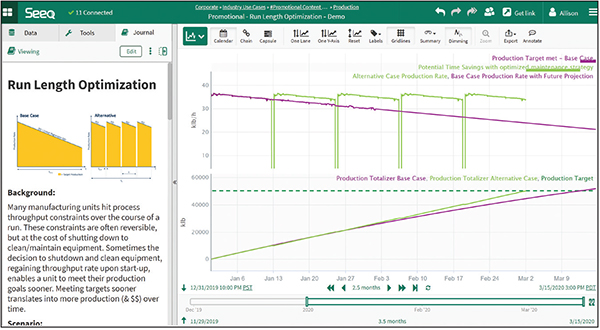
Figure 1. These charts depict the optimization problem to be solved (top) and the Seeq Workbench graphical solution to the problem (bottom), respectively
Deploying the online model in the advanced analytics application environment allowed it to be used in the early stages of subsequent production campaigns. After observing the fouling rate during the first days of the run, the model was used to identify the optimal number of fouling/defouling cycles, and to calculate a trigger indicating when the online cleaning operation should be performed.
A sold-out production unit implemented this model-based defouling strategy and was able to meet customer orders an average of 11% sooner over the course of the year. In a high-demand market environment, they were able to creep their production capacity, filling the newly tapped reactor availability to grow profit and market share.
Catalyst end-of-run prediction
The fixed bed catalyst in a hydrodesulfurization (HDS) unit degrades over time, impacting product quality. Rate reductions are typically used to hold product quality within limits, but eventually the performance degrades to a point where it is no longer economical to run, at which point the catalyst must be replaced. The replacement typically occurs as part of a coordinated turnaround event, so an accurate prediction of the end-of-life date, well in advance, is required for effective turnaround planning.
The weighted-average bed temperature (WABT) is a key metric often used as a proxy to indicate catalyst bed health. Accurately predicting the WABT for optimized production is challenging as the model must consider expected fluctuations due to adjustments to process variables, such as flowrate and composition. Data cleansing techniques, such as outlier and downtime removal and signal normalization, must be applied to the calculated WABT signal to create a suitable input signal for a regression algorithm.
Process engineers at one large chemical company were investigating whether the degradation rate of their catalyst bed had accelerated in recent months. They used Seeq Formula to create a first-principles model of the WABT, cleansing the signal to only include data when the unit was in operation (Figure 2).
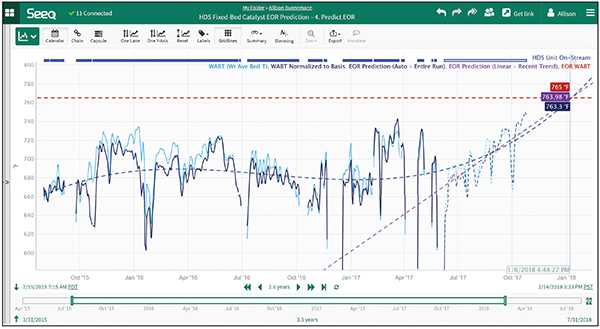
Figure 2. Comparison of weighted-average bed temperature (WABT) predictions from the full data set and a recent sample both indicate maintenance requirements in the coming months
Normalization of the WABT signal was performed using known constants to correct for variability in feed flow and composition. Multiple regression models were developed, and forecasts were extrapolated to predict the required maintenance date. After building these predictive models, it became clear that the degradation rate had become much more aggressive over the last few months, and that their original time-based catalyst changeout would not come soon enough if they continued to operate at current production rates. This analysis justified earlier catalyst change, eliminating months of constrained rate operation and saving over $5 million.
Industry in transition
Chemical companies worldwide must optimize their production processes to increase throughput and flexibility while cutting maintenance costs. Advanced analytics applications are often the best tool to reach these goals, with much less time and effort required from existing staff. These self-service applications empower experts to directly interact with the data sets of interest, providing solutions to many previously intractable problems.
Product transition optimization
CPI facilities often need the flexibility to produce a wide range of product variations in an optimal manner. Product transitions requiring physical modifications to equipment lineups or feed vessels are typically executed during shutdowns, while other types of transitions only require adjusting process set points and can be performed on-the-fly.
These product transitions are a necessary byproduct of a just-in-time production strategy, which minimizes inventory costs by producing to fulfill orders on a recurring basis. Both shutdown and on-the-fly transitions come with performance losses, such as downtime, throughput reduction and poor product quality. The first challenge in minimizing these losses is performing historical benchmarking of previous similar transitions, which requires accessing and analyzing large volumes of data.
Past attempts at product transition analytics required engineers to do multiple Excel queries and manual data manipulation just to locate when the transition occurred. In many cases, apples-to-apples transitions (for instance, from hypothetical product ABC to product XYZ) may have occurred only once or twice a year. Collecting data comprising enough transitions required many initial low-density queries to locate general time ranges of transitions, then numerous high-density queries to pull full resolution data for the hours or days around the transition. Queries to a laboratory information management system were often also required to compile the quality data during each transition period, which would inform when the production of off-specification product began and ended. Only once all this data wrangling was complete could any meaningful analysis begin, and when a different product type transition was required, all the effort needed to be repeated.
A large-scale polymer manufacturer looked to Seeq advanced analytics to solve this challenge. The application infrastructure connected directly to the different data sources, providing live access to all incoming and historical data at a speed dramatically faster than the historian Excel Add-in, and eliminating the need to query multiple source systems.
The modern, cloud-hosted, and browser-based nature of the application meant that their engineers could access the analytics from the plant, their central engineering facility and their homes. Logic-based conditions were used to identify when there was a step change in product type or setpoint signals — for example when the starting product was ABC, the ending product was XYZ, and the throughput rate was above the minimum allowable rate — but only while the product quality parameters measured in the laboratory were not within the specification range for either product.
The events were overlaid using a capsule time feature (Figure 3), and metrics were calculated to benchmark the minimum/maximum/average transition time, identify optimal transition production rates, and plan loss targets.
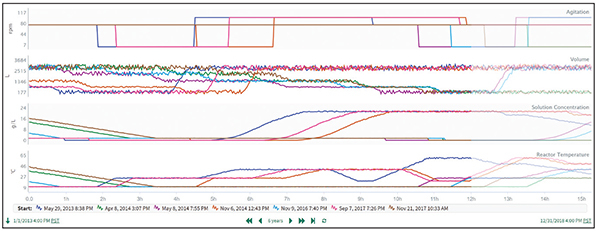
Figure 3. Process parameters are easily overlaid for equivalent transitions using a capsule time tool
The results of this analysis saved the company an average of $50,000 in product-downgrade margin losses per transition, for annual savings in excess of $1 million.
Scaling predictive maintenance efforts
Maintenance strategies have been evolving in recent years from reactionary to time-based to condition-based, and ultimately to the current state of predictive, as in this use case, and prescriptive maintenance.
Time-based preventative maintenance strategies are the simplest and easiest to scale, with companies setting an interval in a maintenance database when the equipment is installed, and then scheduling and executing the work regardless of the condition of the equipment.
Condition-based maintenance has been scalable when an existing asset structure containing each of the relevant sensors and their maintenance thresholds is in place. Predictive maintenance strategies have typically been limited to a small number of long lifecycle assets due to complexities in model-building, large data volumes, individual asset nuances, and organizational silos.
Forecasting future equipment behavior requires both advanced statistical analysis capabilities and strong process expertise. These challenges underlying scaling of predictive analytics for maintenance have become a barrier to successful deployment for entire fleets of assets.
One chemical company was looking to improve its control-valve maintenance strategy. Feed valves critical to product quality were being serviced on a very frequent basis, and the company wanted to evaluate if a predictive maintenance strategy could cut maintenance costs. It then hoped to deploy a model-based predictive maintenance strategy to all control valve assets within the company.
Advanced analytics applications have made this type of predictive maintenance strategy possible at scale. The company’s engineers and data scientists collaboratively used Seeq Workbench to build a model comparing the theoretical versus operational valve-flow coefficient (Cv) of one control valve. Seeq conditions were used to indicate periods of time when the performance of the valve was degrading, and to identify past failure events. Looking over historical data, the site subject matter experts (SMEs) concluded that the model had notified of each impending failure with enough warning time to deploy maintenance resources and repair the valve before it failed.
The company’s data science team used Seeq Data Lab to build an asset hierarchy that contained all the valves in service throughout the organization, organized by site and process unit. Process SMEs and reliability engineers gave input as to which valve assets might require additional variables and assumptions in the model building based on the type of valve and the available instrumentation. The asset hierarchy enabled SMEs to quickly swap among assets and leverage roll-up views, like treemaps and tables, across assets.
Scaling the model analytics from the single control valve to each valve within the asset model required a large amount of computational power. Seeq Cortex deployed in the cloud provided the computing resources required to perform the analysis across all the valves within the site and the organization. An organizer topic was built containing key performance metrics for each site, along with treemap visualizations highlighting the valves showing signs of declining or poor health.
Edited by Mary Page Bailey
Author
Allison Buenemann is an industry principal at Seeq Corp. (Email: [email protected]; Website: www.seeq.com). She has a B.S.Ch.E. from Purdue University and an M.B.A. from Louisiana State University. Buenemann has over five years of experience working for and with chemical manufacturers to solve high-value business problems leveraging time-series data. As a senior analytics engineer with Seeq, she was a demonstrated customer advocate, leveraging her process engineering experience to aid in new customer acquisition, use-case development and enterprise adoption. In her current role, she enjoys monitoring the rapidly changing trends surrounding digital transformation in the chemical industry and translating them into product requirements for Seeq.