Modeling and pilot testing can minimize its impact during natural-gas processing
Retrograde condensation (RC) occurs in multi-component natural-gas streams at relatively high pressures (for instance, pressures above 40 barg/580 psig). The presence of condensed liquids in such systems can have detrimental effects on the performance of liquid-gas coalescer separators, and hence on downstream gas-processing operations. This article reviews several techniques that are available to evaluate retrograde condensation — including both modeling software and pilot testing — and discusses several methods to better control liquid separation and improve process operations.
What is RC?
Retrograde condensation is defined as a “phenomenon associated with the behavior of a hydrocarbon mixture in the critical region wherein, at constant temperature, the vapor phase in contact with the liquid may be condensed by a decrease in pressure; or at constant pressure, the vapor is condensed by an increase in temperature” [1].
The term retrograde means contrary to what we would expect. In this scenario, retrograde refers to the fact that the behavior goes counter to what one would normally expect — that is, that under most conditions, lowering the pressure at constant temperature will cause liquids to evaporate, not condense. Retrograde condensation will depend on the composition of the gas, and the temperature and pressure in the system. During the processing of natural gas, retrograde condensation typically occurs at pressures above 580 psig (40 barg) and is very sensitive to the higher-boiling-point components in the gas (C6+ content).
For many liquid-gas separation technologies, the gas flows through a vessel and separation media as a normal course for collecting and removing liquid contaminants. Figure 1 shows a cutaway drawing of a high-efficiency liquid-gas coalescer.
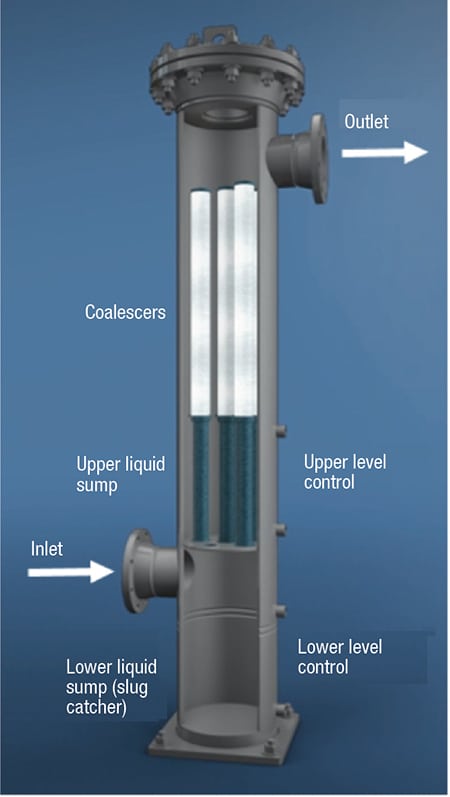
FIGURE 1. Shown here is a typical two-stage, high-efficiency vertical liquid-gas coalescer system that includes an inlet slug catcher
Coalescers will experience pressure drops that are typically in the range of 3 to 15 psid (pounds per square inch differential) over the course of their service life. Pressure drop is caused by inertial losses as a result of the expansion and contraction in the vessel, due to nozzles and the coalescer adaptor connections, as well as from viscous losses from the flow of the gas through the coalescer cartridges. High-efficiency coalescers use a porous medium made from fibrous materials. This medium is designed with fine pores to catch small aerosols down to submicron sizes.
As a result of the pressure drop across the liquid-gas separation system, liquids may be generated if the process is operating in the retrograde region. The use of a surface treatment on high-efficiency vertical liquid-gas coalescers has been found to improve drainage, and thus allow for more compact sizing [ 2]. As retrograde condensation can occur in the coalescer medium wherever there are pressure drops, the coalescer elements will have liquids present throughout the full length of the cartridge during operation. This will affect the sizing of these systems to maintain optimum performance.
Typical problems that can occur
The presence of liquid hydrocarbon condensates that are formed through the retrograde mechanism creates a contamination risk (similar to that posed by any unwanted hydrocarbon liquids that are not effectively separated during gas-processing operations). What makes retrograde condensation especially difficult is that small droplets, which can can form when differential pressure is in the range of just a few psid, can result in additional liquids condensing throughout the plant.
A few processes that can be adversely affected by this phenomenon are discussed in the following section:
Molecular sieves . When molecular sieves are used to remove water vapor from natural gas, liquid hydrocarbons can block off sites, reducing the overall drying capacity of the sieve. Meanwhile, during the thermal-regeneration cycle, heavier hydrocarbons may not desorb quickly enough, and this can result in fouling or coke buildup on the molecular sieve material, and progressively diminished capacity for water removal and reduced service life [3].
Low-NOx burners . Innovation in burner technology has led to several ways to reduce oxides of nitrogen (NOx) emissions, but such new burner designs typically have smaller orifices that can be more prone to plugging and fouling. Heavy deposits of hydrocarbon-decomposition products may build up on the burner internals, leading to poor flame and heating patterns in the furnace, and may require excessive maintenance to clean fouled burners [4].
Gas compressors .Liquid hydrocarbons can affect both reciprocal and centrifugal vane-type compressors. In reciprocating compressors, liquid hydrocarbons can foul the cylinder heads and valves, leading to unscheduled shutdowns for cleaning or repairs. In centrifugal vane-type compressors, deposits of residual heavy hydrocarbons can cause imbalance in the vane rotation leading to vibration and bearing damage [5].
Acid-gas treatment. Liquid hydrocarbons can enter into the alkanol-amine (amine) loop that is used to remove either H2S or CO2 acid gases from the natural gas stream. This amine is used in a closed, recirculating system that has a contactor to remove the acid gas. Then, on the back side of the process, the amine goes through a regenerator unit, which strips off the acid gas.
For the case of H2S-containing feed gas, the concentrated acid gas is usually sent to a sulfur-recovery unit. Hydrocarbon condensates may be picked up by the amine, and lighter fractions will leave with the acid gas in the regenerator. This can lead to foam generation in the regenerator, excess air consumption in the sulfur-recovery unit, and possibly tripping the sulfur-recovery unit in extreme cases.
The heavier hydrocarbons may build up in the amine loop and become concentrated over time, leading to fouling of heat exchangers and tower internals, and causing foaming in contactors. This can result in carryover of amine into the downstream gas [6].
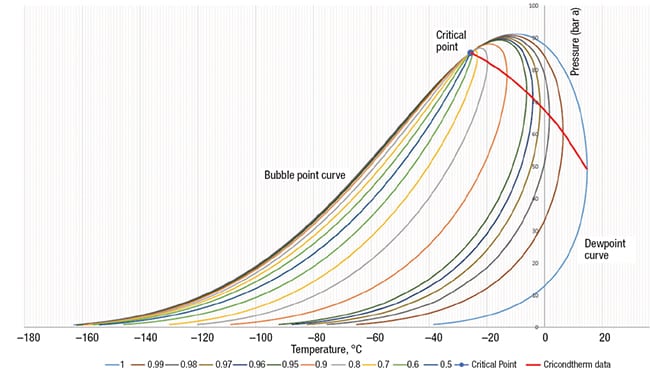
FIGURE 2. This phase envelope, from an offshore platform in Brazil, shows the condensed liquid concentration gradient inside the condensation region the red line is the approximate boundary of the retrograde condensation region. The calculations and diagram were produced using PPDS2 Software and the Physical Properties Database System 2 (PPDS2) / TUV-NEL-UK
Modeling can help
The phase behavior for natural gas with a given composition is typically displayed on a phase diagram, an example of which is shown in Figure 2. The left-hand side of the curve is the bubble-point line. It divides the single-phase liquid region from the two-phase, gas–liquid region. The right-hand side of the curve is the dewpoint line. It divides the two-phase gas–liquid region and the single-phase gas region.
The bubble point and dewpoint lines intersect at the critical point (Tc), where the distinction between gas and liquid properties disappears. The maximum pressure at which liquids can form is called the cricondenbar ( P cc), and the maximum temperature at which liquids can form is called the cricondentherm (Tcc).
However, there is something interesting within the region T c < T < T cc, while traversing the dewpoint curve from a 0% liquid to another 0% liquid condition during isothermal compression. This cuts through the two-phase envelope, which means that liquid is formed, illustrating the phenomenon of retrograde condensation. It is also important to see that a similar behavior is observed within the region P c < P < P cc. In this case, we experience retrograde vaporization while traversing the bubble curve from a 100% liquid to another 100% liquid condition during isobaric heating.
The natural gas phase behavior is a function of the composition of the gas mixture, and is strongly influenced by the concentration of the heavier hydrocarbons, especially hexane-plus (C6+). Figure 3 shows the effect of C6+ content on hydrocarbon dewpoint curves. As shown, the presence of heavier hydrocarbons will increase the size of the phase envelope and failure to include them in a phase calculation will under-predict the breadth of the phase envelope. Therefore, there is an essential need for properly characterizing the lumped heavy-end fraction (through C9 or heavier). A complete detailed analysis of the C6+ fraction including all the heavies can be obtained by laboratory gas chromatography (GC) using a representative sample and performing an offsite analysis, as described in Ref. 7.
![FIGURE 3. Shown here is the effect of C6+ content on hydrocarbon dewpoint [2]](https://www.chemengonline.com/wp-content/uploads/2018/07/31.jpg)
FIGURE 3. Shown here is the effect of C6+ content on hydrocarbon dewpoint [2]
An accurate knowledge of the behavior of natural gas phases is crucial in designing and operating the gas-liquid separation processes efficiently and optimally. This requires the use of advanced predictive tools for the characterization of hydrocarbon phase behavior, and the best possible wellhead sampling and analysis techniques; These concepts are detailed in Ref. 8.
Gas chromatography (GC) is a common, convenient method used to determine hydrocarbon dewpoint as well as the phase envelope (if desired) for compositional analysis in conjunction with an appropriate equation of state (EOS) [7]. The most common EOSs in use in industry today are Soave-Redlich-Kwong (SRK) and Peng-Robinson (PR). Both have been shown to easily and relatively accurately represent the phase behavior in binary and multi-component systems.
Both SRK and PR give good results in accordance with the experimental data up to about 20 bara. However, at higher pressures, those EOSs tend to under-predict the hydrocarbon dewpoints of a gas stream [9]. Generally, at higher pressures, SRK gives dewpoints that are closer to the experimental data compared to the use of the PR methodology. The PR EOS gives a smaller phase envelope than SRK and a good match in the cricondentherm area [ 10]. This effect has been also tested in a research study [ 9] where the authors found that the PR EOS results were in good agreement with the actual hydrocarbon dewpoints, while the SRK EOS predicted dewpoints that were 10–15ºF higher than were observed in the experimental tests.
The PR EOS is given below:
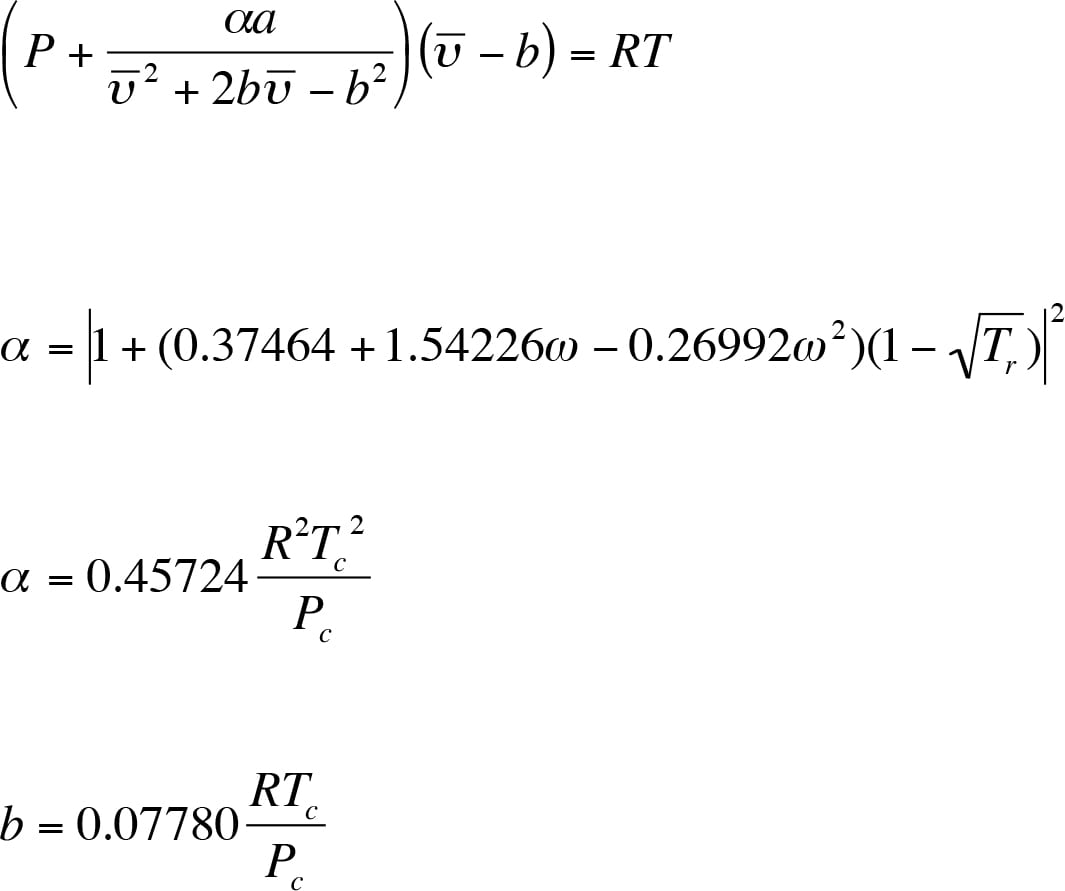
where:
P = pressure, Pa
P c = critical pressure, Pa
T = temperature,°K
T c = critical temperature,°K
T r = reduced temperature, unitless
R = gas constant = 8314.34 M 3 -Pa/(kgmol-K)
V = volume, M3
ω = acentric factor, unitless
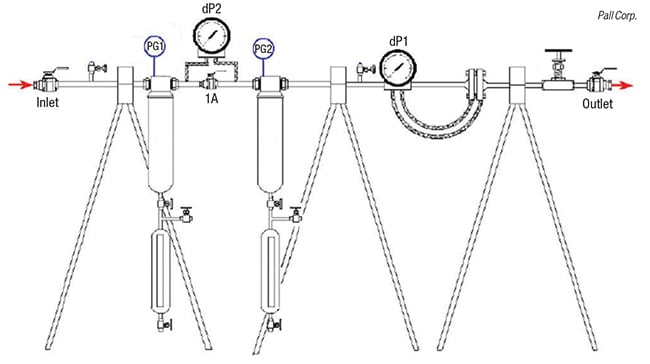
FIGURE 4. Shown here is a gas coalescer system to run field tests for retrograde condensation
Measuring RC in the field
It is possible to run field trials to determine retrograde condensation. Figure 4 shows an apparatus designed for this purpose.
The test equipment consists of two test coalescers (5 in. in length) that are connected in series with a valve (1A) in between to create pressure drop. There are isolation ball valves at the inlet and outlet, and a metering valve upstream of the outlet isolation valve that is used to control the gas flowrate. An orifice plate with a DP gage (dP1) or other suitable flowmeter is used to measure the flowrate. A second pressure gage (dP2) is used to monitor the pressure drop between the two coalescers.
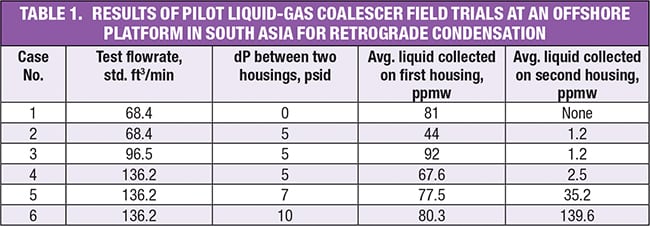
The unit is first run with the valve 1A open and the amount of liquid collected in the first and second test coalescers are recorded over a period of time — typically a few days. A pressure drop is created across the 1A valve with increments of a few psid and then the effect of the pressure drop is determined by any changes in the amount of liquids collected in the second coalescer downstream of the 1A valve.
The pressure drops created are in the range of 3 to 15 psid to simulate what would happen in a commercial unit. This apparatus is not completely isothermal, so there could be some cooling of the gas due to the Joule-Thompson effect. However, in the pressure drop range of 3–15 psid, this cooling would be minimal. If the test is run in the retrograde condensation region, it will be obvious by the large amounts of liquids that will be generated.
Field tests performed by two of the authors at an offshore platform in Southeast Asia indicated the presence of retrograde condensation with data provided in Table 1.
References
1. Parker, S.P., “Dictionary of Scientific and Technical Terms,” 6th Edition, McGraw-Hill, New York, 2003.
2. Wines, T.H., Improve Liquid/Gas Coalescer Performance, Hydrocarbon Processing, 79, 1, 89-96, 2000.
3. Terrigeol, A. and Trifilieff, O., Practical Considerations for the Design of Adsorbent Beds – Molecular Sieve Lifetime Optimization, paper presented at the 23rd Annual Technical Conference of Gas Processors Association – GCC Chapter, Bahrain, Nov. 3-4, 2015.
4. Wines, T.H., Optimize NOx Reductions Facility Wide, Hydrocarbon Processing, 83, 4, 53-59 2004.
5. Wines, T.H., High Performance Liquid/Gas Coalescers for Compressor Protection, presented at the 1999 Compressor Work Shop, Lambton College, Sarnia, Ont., Canada, April 28, 1999.
6. Raymond, A., Levesque, F., and Lakhani, H., Separations Technology Improves Amine System’s Overall Reliability, Oil & Gas Journal, 108, 1, 46-53, 2010.
7. Bullin, J.A., Fitz, C., and Dustman, T., Practical Hydrocarbon Dew Point Specification for Natural Gas Transmission Lines, Research Report 213, GPA Midstream Association, Tulsa, Okla., March 2011.
8. Mokhatab, S., Poe, W.A., and Mak, J.Y., “Handbook of Natural Gas Transmission and Processing,” 3rd Ed., Gulf Professional Publishing, Burlington, Mass., 2015.
9. George, D.L., Barajas, A.M., and Burkey, R.C., The Need for Accurate Hydrocarbon Dew Point Determination,Pipeline & Gas Journal, 232, 9, 32-36, 2005.
10. Rusten, B.H., Gjertsen, L.H., Solbraa, E., Kirkerød, T., Haugum, T., and Puntervold, S., Determination of the Phase Envelope – Crucial for Process Design and Problem Solving, paper presented at the 87th GPA Annual Convention, Grapevine, Tex., March 2–5, 2008.
11. Dustman, T., Drenker, J., Bergman, D.F., and Bullin, J.A., An Analysis and Prediction of Hydrocarbon Dew Points and Liquids in Gas Transmission Lines, paper presented at the 85th GPA Annual Convention, Grapevine, Tex., March 5–8, 2006.
Best practices
Several best practices for evaluating and mitigating retrograde condensation are as follows:
- Use Peng-Robinson EOS to evaluate phase envelopes
- Run a detailed analysis of the heavy hydrocarbon components — at least out to C9
- Run field evaluations with a two-stage coalescer pilot rig to obtain experimental verification of retrograde condensation
- If possible, shift the operating parameters (lower pressure or raise temperature) to get out of the retrograde condensation region
- Size separation equipment more conservatively
a. Design for low pressure drop to reduce retrograde condensation
b. For surface-treated, high-efficiency vertical coalescers, model the separation to have liquids wetting out the full length of the cartridges -
Minimize the distance between separation equipment and downstream process
Authors
 Thomas H. Wines is a director of applications development for Pall Corp.’s Fluid Technologies & Asset Protection (FTAP) Group (25 Harbor Park Drive, Port Washington, NY 11050; Email: [email protected]). Prior to assuming this role, he was director of product management, senior marketing manager and senior staff engineer for the Scientific and Laboratory Services Division at Pall. Wines has 29 years of filtration, separation, and purification experience serving the refinery, gas processing, and chemical industries, and is a specialist in the fields of liquid-gas and liquid-liquid coalescing. He has authored 47 technical publications and given numerous presentations in this field at professional societies. He holds a Ph.D. in chemical engineering from Columbia University, and is a member of AIChE.
 Saeid Mokhatab is an internationally recognized gas-processing consultant based in Halifax, Nova Scotia, Canada (Email: [email protected]), who has worked on the design and operation of several gas-processing plants, and has contributed to gas processing technology improvements through two handbooks and 300 technical papers. Mokhatab has held technical advisory positions for leading professional journals, societies, and conferences in the field of gas processing, and has received a number of international awards and medals in recognition of his work in the natural gas industry.
 Doug Harris is sales technical support Leader at Pall Corp. (5 Harbourgate Business, Portsmouth, Hampshire, PO6 4BQ, UK; Email: [email protected]). He leads a team of technical inside sales, technical support and applications engineers supporting Pall’s outside sales teams and channel partners in the fuels & chemicals, power generation and machinery markets. Harris has worked at Pall for more than 28 years, with roles in Scientific & Laboratory Services, Sales and Marketing, maintaining a focus on the applications of filtration technology in the industrial markets. He holds a bachelor’s degree in chemistry from the University of Southampton, and is a member of the Royal Society of Chemistry.