Use this visual mapping method to assess functional qualifications
A variety of factors — including a shift in the median age of workers worldwide and the impending skills shortage due to attrition and early retirements — have created a need to find fast and reliable methods and tools for mapping the technical competencies of professionals in the chemical process industries (CPI). Typically competency-mapping projects in the CPI begin with some form of task or hierarchical job analysis. However, historically many of these initiatives have been slowed down or have even failed due to incomplete or excessive lists of competencies, a lack of sense of ownership among the workers and a lack of fit between generic competency maps and project-specific requirements. Some competency map designs capture “what needs to be done” with “how it is done and who does it.” Such maps have a short shelf life because they have to be recreated every time there is a change either in the reporting structure or in the tools being used by the enterprise.
The main objective of this article is to introduce a new framework for mapping functional competencies and to share new insights gained by applying the framework to petroleum-refinery operators and maintenance technicians.
The new framework
The new competency-mapping framework (U.S. Patent No. 61/358,262 pending) is used to map technical competencies and it employs the model described below.
Certain minimum levels of cognitive competencies (or knowledge) and functional competencies (or skills) are required for a person to qualify for a task. Additional meta-cognitive, social and context-specific competencies enable a qualified person to excel at his or her job.
As shown in Figure 1, the framework consists of three grids or maps. The first map shows “what needs to be done.” This map is called the outcome/experience (O/E) map because it shows the value-added outcomes and can also be used to capture workers’ experience. A “value-added outcome” is something for which someone is willing to pay an employee. Monitor a process line, diagnose a compressor problem, write a plan, analyze a sample, teach mathematics, escalate a distillation unit problem, optimize a process unit — these are examples of value-added outcomes. A blank O/E map can also be used by an employee to mark all the value-added tasks he or she has done in the past.
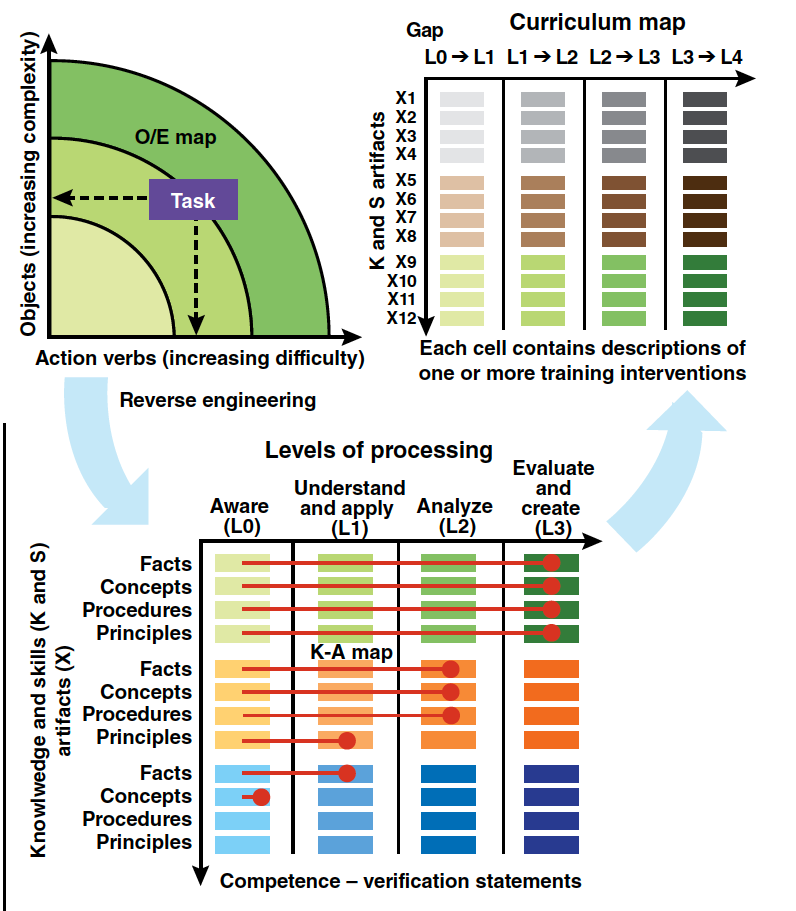
The second grid or map in Figure 1 shows “what one needs to know and be able to do” in order to qualify for each task shown in the first map. This second map is thus called the knowledge-ability (K-A) map and is derived from the first map by reverse engineering each task. The rows of the K-A map contain artifacts divided by types of content. This division of artifacts into facts, concepts, principles and procedures is based on the Component Display Theory (CDT) developed by Merrill [1].
• Facts (sometimes called vocabulary) include names, labels, values and designations that are associated with objects, places and events. Facts are usually time-bound or ephemeral. Facts are easier to identify than concepts
• Concepts are concrete or abstract categories that enable grouping of several facts. Concepts are generally not time-bound and are considered to be universal
• Principles are rules or relationships that connect two or more concepts
• Procedures consist of sets of steps that must be executed in a specific sequence to accomplish specific tasks
Each of the columns of the K-A grid represents a level of cognitive, affective or psychomotor outcome. Cognitive domain involves knowledge and development of intellectual skills. Bloom [2] originally proposed a taxonomy to assess outcomes of learning. Bloom’s initial work focused on the cognitive domain. He divided a learner’s cognitive development into six levels. He labeled each level by a specific mode of cognitive processing used by the learner.
Bloom’s taxonomy is used extensively in the field of instructional design and development. His work was later extended by other researchers to include taxonomies for outcomes in the affective [3] and the psychomotor domains [4]. Affective domain focuses on attitudes, emotions and feelings. Skills in psychomotor domain describe ability to physically manipulate a tool or an instrument.
The last map (top-right) in Figure 1 is a curriculum map that lists all training interventions recommended for bridging all possible competency gaps. Here is an example of a competency gap: If for a specific artifact (say, X5), an individual needs to be at L2 to qualify for a task but is at level L1, there is a competency gap (defined as L2–L1).
The individual needs to participate in a specific training intervention outlined in the curriculum map corresponding to the artifact X5 and in the column that shows L1–L2 that will move that individual to level L2. The K-A grid illustrated in Figure 1 has 12 artifacts shown in column one and has four levels (L0, L1, L2 and L3).The maximum number of possible qualifications gaps for that specific grid is 48.The curriculum map for that situation shows 48 cells. Each cell contains at least one training intervention. Additional details on the framework and the maps are available in the literature [5–7].
The process outline
As shown in Figure 2, the process for developing training plans using the new framework consists of three phases: Create competency maps and a curriculum map (Phase I), identify competency gaps (Phase II), and develop a training-intervention plan (Phase III). The recommended process for the first phase includes the following steps:
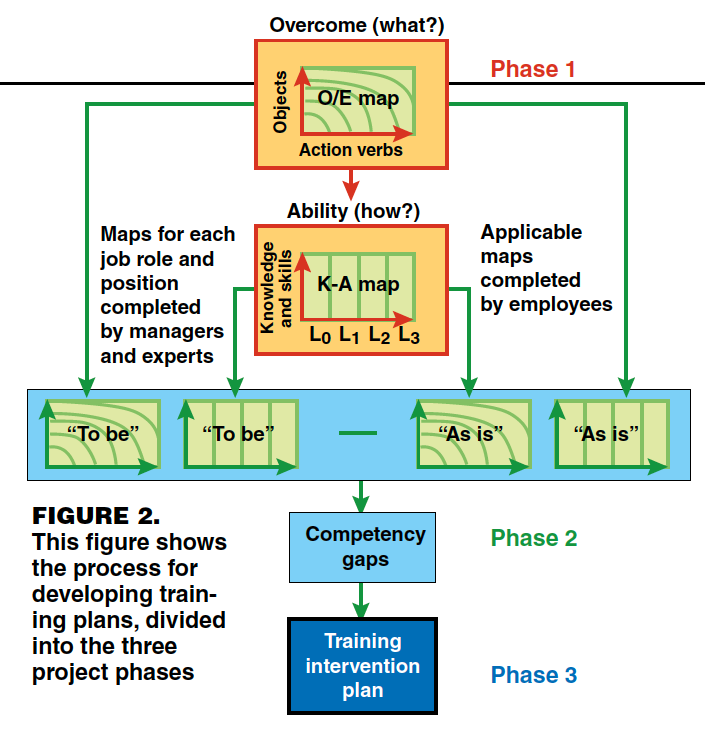
Step 1. Start with the creation of O/E map. Break down each task description into an action verb and an object, such as “Diagnose a problem.” Show the verb on the x-axis and the object on the y-axis.
Step 2. Identify the “most relevant” cycles or processes. Objects shown on the y -axis typically follow a life-cycle consisting of different states. Each function, discipline or group performs work using one or more core processes that distinguish it from other functions, disciplines or groups For example, engineers often rely on a problem-solving cycle, software developers use a development cycle, and project teams use PDCA (for “plan, do, check, adjust”) or some other variation of the Demming cycle [8]. The core work processes performed by a function or a group may vary depending on the state of the object. Use of cycles ensures that the list of verbs is a closed list.
Step 3. Position verbs and objects on the two axes. Arrange all of the verbs, such as monitor, optimize, plan, verify, design, commission, and so on, in an order of increasing difficulty on the x-axis (columns). Rearrange all the objects (components, functional units, process units and so on) vertically in an increasing order of complexity. This ensures no overlap between tasks (shown in cells) and also permits linking of different job levels to different sets of tasks. The job levels increase diagonally as one moves away from the origin.
Step 4. Derive the K-A map. From the O/E map, derive the K-A map by reverse engineering each cell on the O/E map. For example, if the task is “Monitor process lines” ask the questions: How do you define “monitor”? What specific steps are involved? Define “process lines” as explicitly as possible. Break down all the answers for a given task into facts, procedures, concepts and principles and then list them on the y-axis (rows) of the K-A grid. Use Bloom’s and other taxonomies [2–4] to define the relevant levels (three or four) of cognitive, affective and psychomotor processing. Write competency statements for each cell in the K-A grid. One competency statement is written for each artifact for each level. A competency statement includes objective and observable attitude expressed, product created or behavior demonstrated by a person at the selected level of development for the selected artifact.
Case study. Discussed below is a case history that illustrates how to map the competencies of petroleum-refinery operators and maintenance technicians. There are around 717 oil refineries worldwide of which about 132 are located in the U.S. [ 9]. Operators are the “eyes and ears” of the enterprise closest to the unit. They play a significant role in ensuring safe operation, regulatory compliance and high uptime for petroleum-refinery units. Maintenance technicians ensure integrity, reliability and safe operation of all the assets. Operators and maintenance technicians work in round-the-clock in shifts. A typical refinery with ten process units employs about 300 operators and about 100 maintenance technicians.
Acknowledging the potential threat created when “knowledge walks out the door” over the next five years, Ecopetrol, S.A.’s petroleum-refining business unit, which operates two major refineries in Colombia, set the following strategic goal for its refining business unit: “By the end of 2011, Ecopetrol will have 80% of all its professionals working at 100% of their competency level.” In 2007, Ecopetrol began developing competency maps for refinery engineers. The mapping process was based on the new visual framework that resolved many of the issues with the traditional approaches. The maps for engineers were completed in 2008 and a training program was launched in 2009 to bridge the identified competency gaps.
In 2009, Ecopetrol decided to extend the same competency-mapping approach used by engineers to all other professionals at the petroleum refineries in Barrancabermeja, and Cartagena, Colombia. As of this writing, competency maps have been created for operators and maintenance technicians, and a training program is underway at those facilities.
Figure 3 shows a section of an O/E map for process plant operators. The complexity of objects increases as one travels up the y-axis (rows). Individual components appear at the bottom, and large integrated systems are at the top of the y-axis. For plant operators, the object cycle of relevance is the plant life cycle.
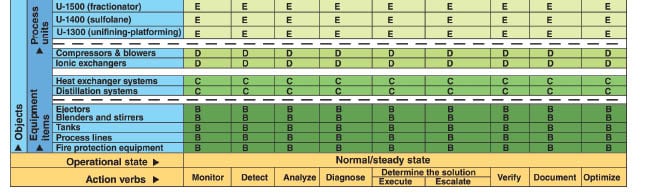
The plant life cycle states are shown on the x-axis. One of the states of this plant lifecycle is the “normal operations state.” Under this state, the process executed by the operators is the “problem identification and reporting process.” The x-axis (columns) in Figure 3 shows the action verbs arranged by ascending degree of difficulty of execution as one moves away from the origin. The letters B, C, D and so on that are shown in the cells of Figures 3 and 4 represent different job levels for plant operators. Levels B, C and D are for field operators. Levels E and F are job-levels of board or panel operators responsible for monitoring entire process units.
Figure 4 shows an O/E map for maintenance technicians specializing in electrical equipment items. The representative activity cycle for maintenance technicians is the repair order cycle. It is nested under the equipment or plant lifecycle. The x-axis (columns) in Figure 4 shows the action verbs in the repair order cycle arranged by degree of difficulty as one goes from left to right. The letters B, C, D and so on that are shown in cells are job levels for maintenance technicians.
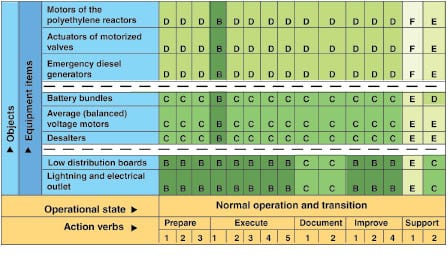
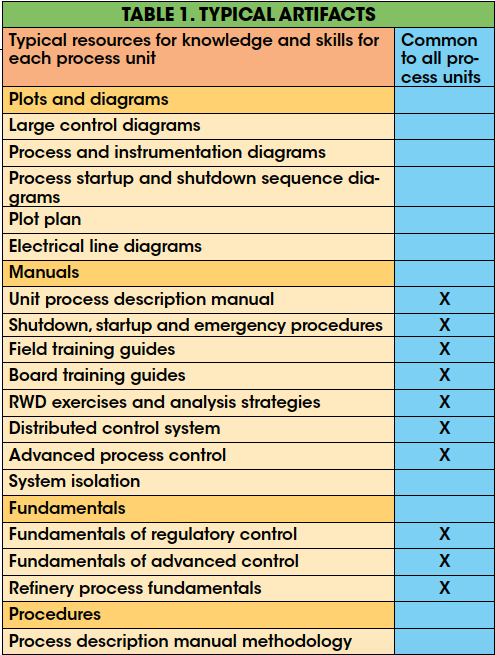
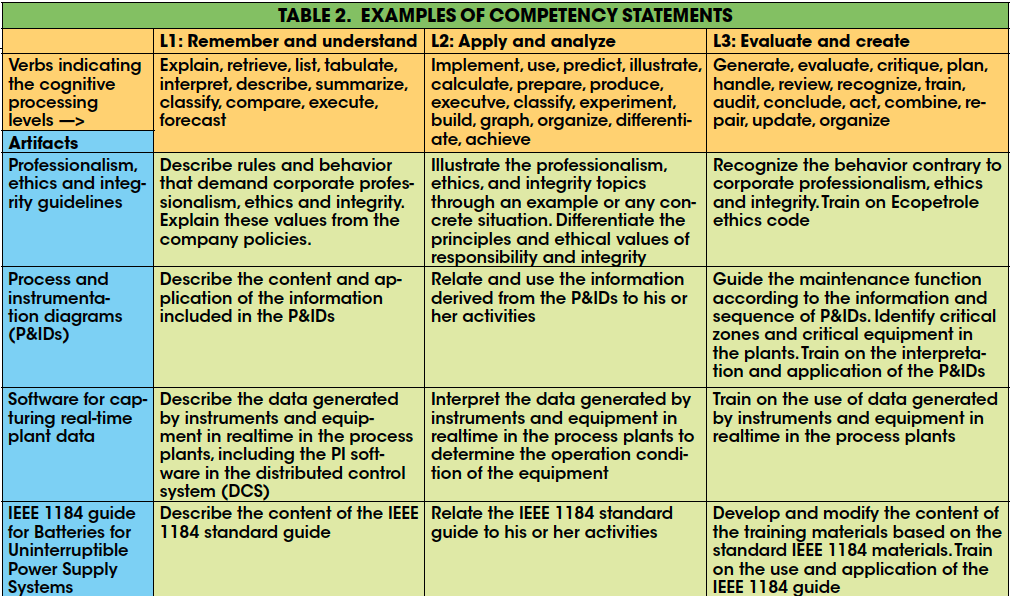
Table 1 shows a list of typical artifacts — divided into drawings, manuals, fundamentals and procedures — that occupy the vertical axis of the K-A map for the board operators. Table 2 shows a section of the competency map for the maintenance technicians. Note that the competency statements shown in the cells of the grid in Table 2 are written as externally observable actions or outcomes that can be used to verify the level of each learner’s development.
Findings
We gained new insights from the process of applying this new framework and from the deliverables created by the process. It is important to make the competency-mapping process visual and develop it from the bottom up. The main success factor for the project was that the operators and maintenance technicians quickly recognized the value of the approach. This removed the cognitive barriers to its implementation. The visual nature of the process made it easy to explain to both the company executives and the employees. The managers saw how the maps can be used to identify strategic gaps, develop hiring plans and provide career guidance to new operators and maintenance technicians. The hierarchical breakdown of competencies allowed for highly pinpointed training interventions to be selected to bridge specific competency gaps.
Operators and maintenance technicians in the refining business share many common traits. The study showed that the following common competencies — problem-solving, troubleshooting, and systems-thinking capabilities — are required to move up in the job levels for both. The study also showed that these two types of professionals — operators and maintenance technicians — share over 30 competencies that are related to topics such as company vision, mission and values, organization structures, Hazop analysis and more. Operators and maintenance technicians also use many common software tools for such activities as data gathering, documentation and communication. Since operators and maintenance technicians are expected to work together, the identification of many common competencies creates an opportunity to conduct joint training sessions, which in turn will save costs and will help improve the teamwork between the two groups.
However, there are overt differences in how the two jobs are organized, and there are subtle differences in the mindsets that are required to be good at each job. Operators generally start as field operators. The main focus of field operators is equipment items such as pumps, turbines, tanks and so on. When they become board or panel operators their emphasis shifts to process units such as an aromatics unit, ethylene unit, steam system and so on. This parallels the career-development path of process engineers. Maintenance technicians start by focusing on equipment components (rotors, shafts, welds and so on) and eventually shift to equipment systems. But unlike operators, the maintenance technicians are routinely organized by specialty areas such as mechanical, electrical and so on. Thus, their career progression often parallels those of mechanical and electrical engineers
For plant operators, the core process is problem identification and solution. By comparison, the core process for maintenance technicians is the repair-order cycle. The work of maintenance technicians is more structured and regulated than that of operators. This means that operators have to cultivate the ability to “improvise on demand” without risking the safety of the plant. Meanwhile, maintenance technicians have to be more cognizant of newer techniques, regulations and budgets relative to the operators.n
Edited by Suzanne Shelley
Acknowledgements
The views and opinions expressed in this article are those of the authors and do not necessarily represent the views and opinions of any other entity mentioned in this article. The authors are grateful to Ecopetrol, S.A.’s maintenance discipline leaders and operations team members, who provided useful insights, shared experiences and participated in the creation of the competency maps. Special mention must be made of Angela Corrales- Ecopetrol, S.A.’s operational excellence team leader for the Barrancabermeja refinery, for her unwavering support for this initiative.
References
1. Merrill, D., Component display theory, in “Instructional Design Theories and Models: An Overview of their Current States,” C.M. Reigeluth (ed),Hillsdale, N.J., Lawrence Erlbaum, 1983.
2. Bloom B.S., “Taxonomy of Educational Objectives, Handbook I: The Cognitive Domain,” David McKay Co., New York, 1956.
3. Krathwohl, D.R., Bloom, B.S., and Masia, B.B., “Taxonomy of Educational Objectives, the Classification of Educational Goals. Handbook II: Affective Domain,” David McKay Co., New York, 1973.
4. Simpson E.J., “The Classification of Educational Objectives in the Psychomotor Domain,” Washington, D.C., Gryphon House, 1972.
5. Ranade, S.M., A competency framework for refinery process engineers, Hydrocarbon Proc., July 2008.
6. Ranade, S.M., et al., Competency mapping, Mech. Eng., Feb. 2010, p. 53.
7. Ranade, S.M., Reframe jobs; Reap rewards, People & Strategy, July 2010.
8. en.wikipedia.org/wiki/PDCA“>en.wikipedia.org/wiki/PDCA”>en.wikipedia.org/wiki/PDCA, Accessed Jan. 2011.
9. BERA: Issue 5/6. “The Oil & Gas Industry: Refining” (Business Reference Services, Library of Congress), Winter 2005/Spring 2006, Washington, D.C., U.S. Library of Congress, Issue 5/6. 10. www.loc.gov/rr/business/BERA/issue5/refining.html“>www.loc.gov/rr/business/BERA/issue5/refining.html“>www.loc.gov/rr/business/BERA/issue5/refining.html“>www.loc.gov/rr/business/BERA/issue5/refining.html, Accessed Jan. 2011.
Authors

Saidas M. (Sai) Ranade is a manager for process and product innovation in RWD Technology, LLC’s energy practice (55 Waugh Drive Suite 200, Houston, TX 77007; Email: smranade@swbell.net). He has a B.S.Ch.E. from U.I.C.T, Mumbai, India. Saidas earned his Ph.D. in chemical engineering from the University of Houston, where he also taught thermodynamics. He is the principal developer of the competency model and tools described in this article.

Jorge Eliecer Rodriguez Gomez is a program leader of maintenance excellence for Ecopetrol S.A.’s Barrancabermeja refinery. He is an electrical and electronics engineer (Industrial University of Santander, Colombia), a certified maintenance and reliability professional (CMRP), and a candidate for a master’s degree in industrial engineering with an emphasis in refining and petrochemicals management (University of the Andes, Colombia). He has also held the positions of maintenance coordinator and metrology leader at the refinery.

Rafael Vasquez Ortiz is a training leader for operational excellence for Ecopetrol, S.A.’s Barrancabermeja refinery in Colombia. Prior to his present role, he was an operations supervisor for four years. He started his career with Ecopetrol almost 19 years ago, as an operator, and has operations experience in many refinery units including those producing amine, sulfur recovery and ethylene.

Juan Carlos Rocha Montano is a senior technical engineer in RWD Technologies, LLC’s Bogota, Colombia, office. He earned his B.S.E.E. from Colombia National University. He has been a project manager and maintenance manager for a petrochemical company. His current interests include energy conservation, knowledge theories and training for adults.