Most engineers know what viscosity is, but may have trouble explaining it. To be brief, viscosity is resistance to flow. For handlers of all materials that flow, either while being processed or in an end-use, it is important to think about the materials’ flow characteristics. The bottom line is to come up with ways to measure viscosity so that you can quantify whether a material will flow the way it needs to.
This article reacquaints the reader with the basic concepts and terminology for viscosity and addresses techniques to quantify it. An important concept, sometimes forgotten, is that a material’s viscosity is not a single-point measurement, but often depends on a number of factors.
Take asphalt, for example. The standard test method for pumpability, according to ASTM D4402, is to use a regular viscosity (RV) torque rotational viscometer at 20 rpm or a low viscosity (LV) instrument at 12 rpm. Record the viscosity value, make sure that it falls within prescribed maximum and minimum limits, and then report whether the number passes or fails. However, this straightforward single-point test does not provide the complete picture for asphalt flow behavior. When pumping asphalt, the startup torque required to get the pump going initially suggests that a second viscosity test at a much lower rotational speed makes sense. Experiments have shown that the viscosity values obtained at 0.1 or 0.01 rpm can be several orders of magnitude higher than the one recorded at 20 rpm.
Raw materials in the chemical process industries (CPI) usually have a reported viscosity value on the data sheet that accompanies the product. Data sheets for some polymer solutions, for example, may include a discrete number like 4,500 centipoise (cP), but no further information about how the measurement was made, not even the test temperature at which the polymer was measured. To perform a valid verification check and confirm that the material is within specification requires a duplication of the test method used by the manufacturer. The only alternative in these situations is to find the proper authority at the manufacturer and obtain the relevant test details.
The printing ink industry is one of the best examples to illustrate the need for viscosity measurement. When the ink is too thick, smearing may result during printing; too thin and there can be serious fading of the printed image. There was a time when pressmen could tell by rubbing an ink between their fingers as to how well it would perform “on press”. This rubbing action was, in essence, a viscosity test, the objective being to tell how much resistance was felt between thumb and forefinger.
Printers developed a more scientific approach to viscosity measurement by using cups with holes in the bottom to measure how much time it would take to drain the ink (Figure 1). The cups were relatively inexpensive and anyone working the press could easily learn how to make the measurement. This became one of the earliest quality control (QC) tests that checked systematically for viscosity in a quantifiable way. But the cup method could not always discriminate successfully between inks that proved acceptable and those that were marginal or outright poor performers.
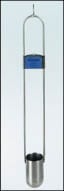 |
| Figure 1. Flow cups are used for measuring the viscosity of inks |
The problem turned out to be a matter of understanding “shear rate” and how it can affect the viscosity of the ink. When testing inks, or any material that flows, it is important to think about how the material will be processed or handled when in use. The “shearing action” that the material will undergo is the analysis that we want to focus on. For inks, the use of a rotational viscometer running at different speeds can simulate, in part, what is happening to the ink during transfer to a substrate. This analytical procedure for simulating the shearing action with an instrument is the key to predicting flow behavior and leads to the selection of an appropriate viscometer to perform the test work that is required.
Kinematic viscosity
Returning to the cup method, note that this type of test uses the force of gravity to drain the ink out of the cup. The shearing action on the ink takes place at the orifice on the bottom of the cup. As the ink level in the cup goes down, the shear rate at the orifice decreases because the weight of the ink remaining in the cup is less and less. This type of measurement, where gravity is the driving force, is referred to as kinematic viscosity.
The petroleum refining industry is a major user of capillary viscometers (Figure 2), which like the flow cups, also measure kinematic viscosity. A measured sample volume of the fluid flows under the influence of gravity between two etched lines on the tube, and the time of flow is recorded. Taking into account the calibration constant of the capillary tube, these highly precise instruments report data in scientific units of mm2/s, or centistokes (1 cSt = 1 mm2/s). The standard test method for many liquid petroleum-derived products is ASTM D445, which also requires strict temperature control when measuring viscosity with the capillary viscometer. This recognizes the effect of temperature on flow behavior and the need to standardize test results by holding temperature constant. Petroleum-derived materials tend to be Newtonian by nature (the viscosity value remains the same, no matter what shearing action takes place), so the high precision of these instruments is very important to achieving accurate viscosity values.
 |
| Figure 2. Capillary viscometers measure kinematic viscosity |
Dynamic viscosity
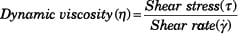
Rotational viscometers (Figure 3) have become a widely accepted tool for the measurement of viscosity across a number of industries, including certain parts of the petroleum refining world, especially those concerned with low temperature behavior. The spindle, when inserted into the test liquid, rotates at various fixed speeds, thereby shearing the material continuously at defined shear rates. Simultaneously the viscometer measures the amount of torque resistance experienced by the spindle at each speed of rotation. This torque measurement is quantified as a “shear stress”, which acts across the surface area of the immersed portion of the spindle. These two key concepts — torque resistance and shearing action — have been combined into an equation that defines dynamic viscosity as the ratio of shear stress to shear rate:
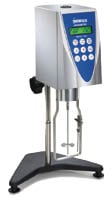
viscometers
(this one with
a disc spindle)
measure dynamic
viscosity
(1)
The unit of measurement used to quantify rotational viscosity is the centipoise (cP) in N. America and most of S. America, and the milliPascal-second (mPa-s) in other countries, although there is some degree of overlap in useage. The fortunate news is that the two units are interchangeable because 1 cP = 1 mPa-s.
There is a way to correlate viscosity measurements made with dynamic and kinematic methods for materials that are Newtonian using the following equation:
Dynamic viscosity = Kinematic viscosity × Density (2)
For non-Newtonian fluids, however, the dynamic viscosity must be determined for each shear rate according to Equation (1).
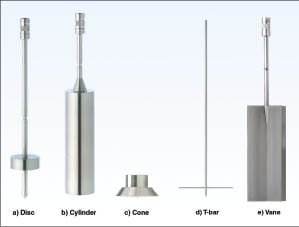 |
| Figure 4. Spindle geometries include: a) Disc; b) Cylinder; c) Cone; d) T-bar; e) Vane |
Shear stress:The type of spindle used to shear the material is an important consideration for making viscosity measurements. The standard disc-type spindle is most commonly used throughout the world since its introduction 75 years ago. Since then, a variety of spindle geometries have come into existence including cylindrical, cone, T-bar, vane and many others of various shapes (Figure 4). The most used geometries for “defined shear rate” calculations are coaxial cylinder (cylindrical spindle in a cylindrical chamber) and cone/plate; the equations that define shear stress and shear rate for these configurations are shown in Figures 5 and 6.
The benchmark material for comparing the viscosity of all materials is water. The National Institute of Standards and Technology (NIST; Gaithersburg, Md.) states that the viscosity of water is 1 cP when measured with a capillary viscometer at a temperature of 20oC. Table 1 shows the viscosity of select materials, to give an idea of how they compare to each other.
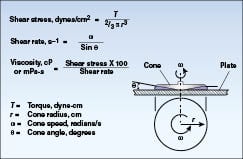 |
| Figure 6. Cone-and-plate geometry calculations |
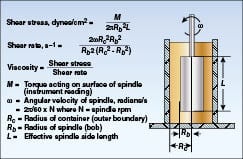 |
| Figure 5. Coaxial cylinder geometry calculations |
| Table 1. Common Material Viscosities | |
| Material | Viscosity (cP) |
| Benzene | 0.6–0.7 |
| Sulfuric acid | 20–30 |
| Motor Oil SAE 30 | 150–300 |
| Glycerin | 1,000–2,000 |
| Glycerol | 1,400–1,600 |
| Asphalt emulsion | >5,000 |
| Grease | >100,000 |
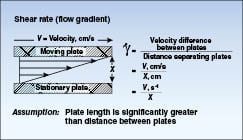
Shear rate:Shear rate is a reflection of the process characteristics as opposed to the process liquid properties themselves and must be quantified separately. Imagine that the fluid you want to test is sandwiched between two plates separated by a known distance. Keep the bottom plate stationary and move the top plate at a defined velocity. Shear rate is the ratio of the moving plate velocity, V, to the distance separating the plates, X.
Shear rate = V/X ( 3)
The unit of measurement for shear rate is reciprocal second or s–1. This approach to quantifying shear rate assumes that the fluid behaves in a uniform way as shown by the arrows in Figure 7. The layers of fluid molecules slide over each other in a repetitive fashion such that the closer you get to the moving plate, the faster the layer is moving.
is quantified
Table 2 gives several examples of shearing action and the shear rate associated with each. The thing to recognize is that you can easily compute the relevant shear rates for your own situation. Consider the shearing action in a mixer. The blades are equivalent to the moving plate and the side wall is the stationary plate. The angular velocity of the blades is easily computed based on the rotational speed of the mixer; the distance from the blade to the side wall is a known dimension provided by the manufacturer. The equivalent shear rate is simply the ratio of those two numbers.
| Table 2. Typical shear rates | ||
| Situation | Typical shear rate range (s–1) | Application |
| Sedimentation of fine powders in asuspending liquid | 10–6 to 10–4 | Medicines, paints |
| Leveling due to surface tension | 10–2 to 10–1 | Paints, printing inks |
| Draining under gravity | 10–1 to 101 | Painting and coating, toilet bleaches |
| Extruders | 100 to 102 | Polymers |
| Dip coating | 101 to 102 | Paints, confectionery |
| Mixing and stirring | 101 to 103 | Manufacturing liquids |
| Pipe flow | 100 to 103 | Pumping, blood flow |
| Spraying and brushing | 103 to 104 | Spray drying, painting, fuel atomization |
| Milling pigments in fluid bases | 103 to 105 | Paints, printing inks |
| High-speed coating | 105 to 106 | Paper |
| Lubrication | 103 to 107 | Gasoline engines |
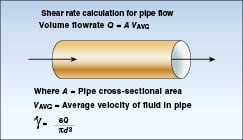
A similar calculation can be done for the shear rate of fluid flow in a pipe, as shown in Figure 8, assuming that the velocity profile of the fluid changes linearly from the pipe wall to the center of the pipe where maximum velocity occurs. Although a linear change in velocity profile is not the usual case, it provides a convenient starting point for an initial calculation.
Material behavior
With these fundamental concepts in place, the important conclusion to recognize is that many CPI materials are non-Newtonian and will change in viscosity as the shear rate is adjusted, in other words, viscosity is not a single number for them.
Pseudoplasticity:The most common type of viscosity behavior is pseudoplasticity, where a material’s viscosity decreases as the shear rate increases. This behavior can be characterized by a flow curve or rheogram (Figure 9). Many of the materials mentioned in this article, with the exception of water and select petroleum refining products, are pseudoplastic. Water is always 1 cP at 20oC no matter what shear rate is used. Just as materials that do not change in viscosity with shear rate are referred to as Newtonian (in honor of Isaac Newton who first postulated the parametric relationships discussed earlier in this article), those which do change are called non-Newtonian.
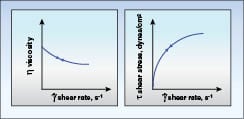
characterize pseudoplastic behavior
Thixotropy:A related issue that affects measured viscosity values is the length of time for the shearing action. If a material is sheared at a constant rate and the viscosity decreases over time, we call that thixotropy. Some materials exhibit thixotropic behavior, but recover completely once the shearing action stops. This is important because the material will not behave as expected by the end user if the loss in viscosity is permanent. For pseudoplastic materials, the way to observe whether thixotropy occurs is to run an up/down test (increase the spindle speed, then decrease the spindle speed) and see if the data for the flow curves are separate, as shown in Figure 10. The spatial area between the curves is an indicator of how significant the thixotropic behavior may be. If the curves lie on top of each other or are relatively close together, there is little to no thixotropy.
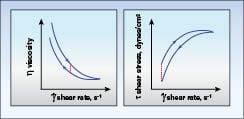
pseudoplastic material
Temperature:Temperature is another key parameter that must be considered when measuring viscosity. As temperature increases, most materials exhibit a decrease in viscosity. So it is important to define the temperature at which the viscosity measurement is made to ensure consistency of results. When new materials are evaluated, it is common to perform a temperature profile test. Run a series of up/down shear ramps at discrete temperatures as shown for the ink sample in Figure 11. This allows manufacturers and users alike to take into account variable ambient conditions that may exist in plants around the world, especially if the viscosity measurement is made out on the plant floor and not in a controlled lab environment.
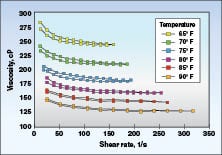
an ink sample is shown with data from shear
ramp tests
Measuring viscosity
Quality control personnel have a better opportunity to perform effective testing when the above concepts are applied to materials handled or produced in the plant. Most companies use a single-point test to check for viscosity, which means a defined spindle running at a single speed. Hopefully, more thorough testing has already been performed showing complete flow curve behavior so that the choice of a single point is relevant and can distinguish good material from that of lesser quality.
Thix Index:Some CPI companies recognize the need for more than one viscosity measurement in QC and use a long-established method know as the Thix Index. Viscosity measurements are made at two separate speeds, normally an order of magnitude apart, such as 50 rpm and 5 rpm. The viscosity value at 5 rpm is divided by the viscosity value at 50 rpm. For a pseudoplastic material, the ratio of the two viscosities is a number that is greater than 1. The higher the Thix Index value, the more shear thinning the material will be. Some resins companies use this technique regularly and report values as high as 4, which indicates significant pseudoplastic behavior.
Formulations are constantly changing as new additives are introduced to enhance the product behavior or appeal. Textured particles in paints, modified asphalts with various filler materials and specialty polymers are only a few examples that show the need for thorough viscosity testing. They clearly suggest that a single-point test is not enough to give the full picture in QC and that a more detailed analysis will be required. The Thix Index can bridge the gap temporarily, but the ultimate realization is that a true viscosity flow curve is needed, and this should become part of the data file that goes with the product record.
Today’s instrumentation is fully capable of running multiple point tests and capturing the data without operator involvement. This more-involved capability does not take any more labor to accomplish. In fact, it may require less since the results don’t have to be manually written down, but instead are captured automatically.
Curing algorithm:One new test method that has become readily available to the CPI through the inexpensive automation of instrumentation is the “curing algorithm,” which allows prediction of an endpoint in a bench-top test. This applies to adhesives, asphalts and select polymer manufacturers who need to know how a reaction is progressing as evidenced by the buildup of viscosity in the material. The viscometer measures viscosity continuously as it builds over time, while rotating the spindle at a defined speed, say 100 rpm at the outset. When the torque reaches a defined maximum, say 95% for example, the spindle speed automatically drops by an order of magnitude to 10 rpm, and the measurement continues without interruption. Again, when the torque reaches 95% as the material continues to build viscosity, the speed drops to 1 rpm, and so forth. The standard instrument shown in Figure 3 can go down to 0.01 rpm. Figure 12 shows the type of viscosity data that results. In addition, the time to cure is also recorded. The advantage of today’s instruments with built-in microprocessors is that the test runs can be unattended, and the data are captured automatically by a personal computer.
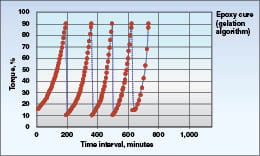
on an epoxy
Yield stress:Viscosity may be the primary variable of interest, but there is a related parameter called yield stress that is critical to measure for some materials. Yield stress is the amount of force that is required to get a material to begin flowing. Returning to the asphalt example earlier in this article, the idea can be applied to any pumping situation. In order to move the material from one point to another, the startup torque required for the pump must be calculated so that the pump is sized correctly. Therefore, the yield stress in the material must be measured and used as the basis for choosing a pump with sufficient startup torque.
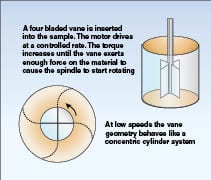
The controlled stress rheometer is the tool of choice for measuring yield stress (Figure 13). The choice of spindle geometry must again be considered. If the quantity of available material is limited, say 2 mL or less (which is often the case with specialty polymer formulations), the cone/plate or plate/plate system is the best choice. Alternatively, coaxial cylinder geometry may also be considered if the available sample size is between 2 and 20 mL. When sample size is not an issue, then vane spindle geometry may be preferred. One advantage of vanes is that the material trapped between the vanes is shearing against the material outside the circumference of the spindle (Figure 14). Other spindle geometries sometimes have the problem referred to as “slip”, where the material in contact with the spindle surface does not move at the same velocity as the rotating spindle. The vane spindle overcomes this potential problem.
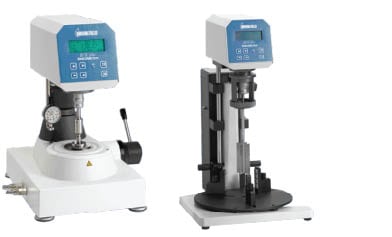
measure yield stress
preferred for yield stress measurements
of higher viscosity materials
The test method for controlled stress is to run a shear ramp. Increasing torque is applied to the spindle until rotation begins, which is essentially the onset of yield stress. The method is depicted in Figure 15. The test is usually short in duration and provides a numerical value that can be used by process engineers for determining the yield stress of the material. This in turn can be used in sizing calculations for the pump and the startup torque performance as well as steady operation at full flow conditions.
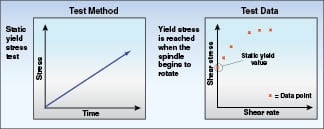
stress rheometer
rheometer is not available, yield
stress can be approximated using
flow-curve data
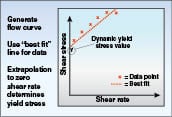
Controlled stress rheometers are expensive instruments and sometimes don’t fit into the budget when this type of information is first needed. An alternative approach is to use the flow curve data (shear stress versus shear rate) from a standard benchtop viscometer and extrapolate the data to zero shear rate conditions (Figure 16). This provides a value for what the yield stress might be, but is most likely not as accurate as the controlled rheometer method. If the test is repeated on multiple samples, and similar values are achieved, the result can be the basis for at least a ballpark value for yield stress.â–
Edited by Dorothy Lozowski
References
1. Brookfield Engineering Laboratories, “More Solutions to Sticky Problems”, available at www.brookfieldengineering.com.
Author

Robert G. McGregor, is the sales and marketing manager for Brookfield Engineering Laboratories, Inc. (11 Commerce Blvd., Middleboro, MA 02346; Phone: 508–946–6200 ext. 143; Email: r_mcgregor@brookfieldengineering.com; Website:http://www.brookfieldengineering.com). He holds M.S. and B.S. degrees in mechanical engineering from MIT in Cambridge, Mass.