Activated sludge processes are inherently complex. Proper system design, operation and maintenance are essential to adequately break down target organic materials
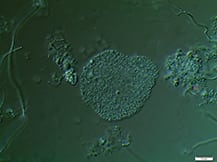
Since its discovery more than 100 years ago in 1914 by Ardern and Lockett [ 1 ], the activated sludge process has been (and still is) the most widely used process to treat domestic and industrial wastewater [ 2,3 ]. It involves the creation and management of a human-engineered and managed ecosystem. Biological reactors support desired microbial populations, particularly bacteria in flocculated forms known as activated sludge flocs (Figure 1). Such flocs are grown as the microbial population, and convert biodegradable organic substances in the wastewater inlet stream into carbon dioxide and new biomass.
 |
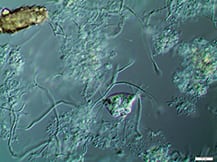 |
| FIGURE 1. These two microscopic images of activated sludge (magnification 200x) show individual bacteria growing as colonies, forming sludge flocs. Some bacteria grow in longer strands (filaments) extending out of the flocs. In the image on the right, the bright particles are precipitated inorganic CaCO3 salts | |
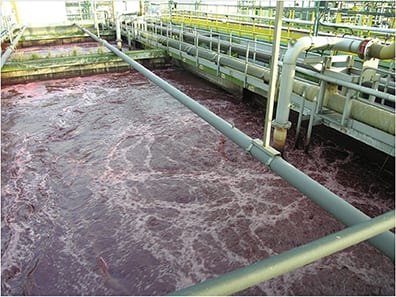
While a typical activated sludge wastewater treatment plant (WWTP) has a relatively simple layout, the underlying biodegradation processes involve exceedingly complex phenomena, which proceed in a series of enzymatic reactions.
Facility operators often overlook the importance of establishing the right colony of microorganisms in an activated sludge system to target the biodegradable organic pollutants at hand
Enzymes play a key role
Enzymes mediate virtually all biochemical reactions in living cells where covalent bonds are formed or broken [ 4 ]. Enzymes are proteins that act as in vivo catalytic agents within the cell, forming complexes with the organic substances. The enzymes convert organics to specific products, while the enzymes are released to repeat the same reaction [ 5 ]. Enzymes are useful, in that they accelerate the most elaborate chemical transformations that would otherwise occur at only imperceptible rates. Two types of enzymes are involved in this biodegradation process — namely extra- and intra-cellular enzymes:
- Extracellular enzymes are excreted at the cell surface by the microorganisms, and they help to break down the pollutants outside the cells into smaller metabolites that are small enough so that they can permeate through the cell walls
- Transported smaller fragments are integrated into the microbial metabolism; that is, they are further oxidized to provide cell energy, or are transformed by intracellular enzymes into new “building blocks” to be used in cellular synthesis [5]
Substrate-specific enzymes
This biodegradation process has further complexity. Next to so-called constitutive enzymes that are synthesized during all the cellular life independently of the presence of specific substrates, so-called inducible enzymes are only produced when a specific molecular signal (resulting from the presence of a specific substrate) is recognized by the cell [ 6 ]. In this case, the microorganisms must produce substrate-specific enzymes to be able to break down the target substrate. What’s more, these induced enzymes are not synthesized instantly; rather, a latent period is necessary to set up the cell apparatus [ 6 ].
Hence, to address hard-to-treat wastewater or to biodegrade target constituents in complex wastewater streams, it is necessary to develop and maintain tailored, acclimated microbial populations within the sludge. The sludge retention time (SRT) plays a pivotal role in this.
Sludge retention time
The SRT (also referred to as the mean cell-retention time, or MCRT) is an important operational parameter that represents the average time spent by the sludge in the biodegradation basin. The SRT is controlled by means of the sludge-wasting rate. For example, in the case of an activated-sludge system that has an inventory of 60 tons of sludge solids, and the total wasting rate is 2 tons of sludge solids per day, the SRT amounts to 60/2 = 30 days. Note that in cases where there are solids losses via clarifier overflow, this additional sludge-removal mechanism needs to be taken into account, as well.
Example of EtS removal. The key role of the SRT, in terms of pollutant removal, will be exemplified here by the removal of ethyl sulfate (EtS), based on a 2-year follow-up at Monsanto’s WWTP in Antwerp, Belgium. The biological removal of poly(vinyl alcohol) (PVA) is also discussed, to further emphasize that certain conditions are needed to create a friendly environment for the target microor ganisms (Figure 2).
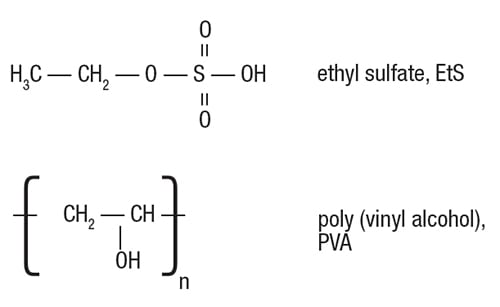
FIGURE 2. The biodegradation of ethylsulfate (EtS) needs specialized bacteria to cleave the bond between the ethyl and sulfate group. Likewise, the long-chain polymeric molecules of poly-vinyl alcohol will only be broken down by microorganisms that are adapted to do so
Different analytical techniques are used to monitor EtS and PVA in wastewater during activated-sludge treatment, including the following:
- EtS — Reagent-free ion chromatography (RFIC) with a hydroxide gradient and conductivity detection
- PVA — Reversed-phase ultra-performance liquid chromatography (UPLC) with single-quadruple, mass spectroscopy detection
For both components, quantification was done with an external standard calibration. The detection limit is 500 parts per billion (ppb).
Figure 3 presents the data related to the EtS concentration in the feed stream, and in the WWTP’s final effluent, as well as the EtS removal efficiency. At the beginning of the timeframe represented in Figure 3, monthly analyses (depicted as two black dots, for June and July 2012) showed no EtS being present in the treated effluent, as usually experenced at this WWTP.
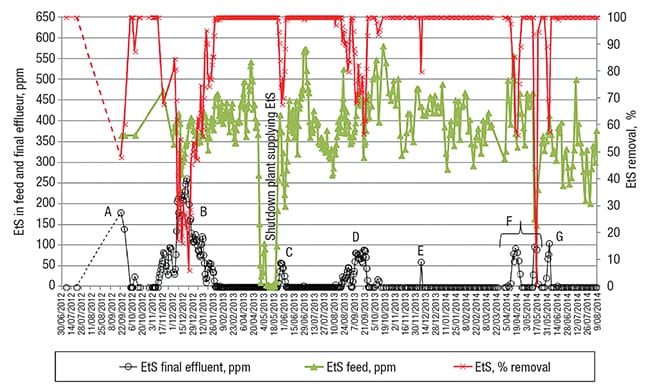
FIGURE 3. Shown here is the ethylsulfate (EtS) concentration in the feed and final effluent at one facility over time, together with its removal percentage. In periods A and B, the EtS removal was poor due to the insufficient sludge age (see Figure 4) and, hence, unadapted sludge
Then, because of an excessively high sludge inventory in the system — due to a high fraction of CaCO3 salt precipitating from the water and being enmeshed in the flocs (thereby increasing the amount of total solids in the biodegradation basin), it became an operational necessity to significantly increase the sludge-wasting rate, starting in the beginning of August. As a result, the SRT, calculated daily and depicted in dark blue color in Figure 4, dropped dramatically from typically 30–40 days to only 10 days.
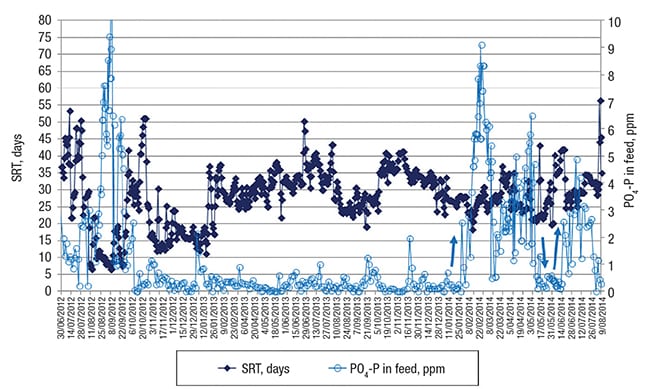
FIGURE 4. Shown here is sludge-retention time (SRT) and phosphorus concentration contributed by phosphate in the feed (PO4-P) over time. At the left side, two periods with a very short SRT of 10 and 15 days can be discerned which resulted in poor EtS removal as depicted in Figure 3. At the right side, the light blue arrows indicate PO4-P increase (or decrease) in the feed which yielded a higher (or lower) removal of PVA as shown in Figure 5
The next detailed analysis of the effluent showed a residual EtS concentration of 175 ppm at the end of September (indicated by the letter A in Figure 3), with a removal efficiency of barely 50% (shown in red color in Figure 3). At that moment, the sludge-wasting rate was lowered again, in line with a theoretical SRT of about 30 days since the end of September.
About two weeks after this corrective action was taken (note that the SRT does not increase instantly as soon as the wasting rate is reduced), the EtS concentration in the effluent was again 0 ppm (the frequency of EtS analysis was increased to a daily analysis for this study). However, a next (still necessary) stage of higher sludge-wasting rate was initiated at the beginning of November, yielding an SRT this time of about 15 days.
Two weeks later, EtS started appearing in the final effluent (this is shown in Figure 3, as the beginning of period B).
A month later, in the middle of December 2012, the EtS removal reached only 20%. As a consequence, the sludge-wasting rate was lowered once again, to stick to an SRT of roughly 30 days (from January 25, 2013 onward). This was only possible by taking into service an additional biodegradation basin that provided additional sludge-inventory-management capabilities. With all of these changes, about 10 days later, 100% EtS removal was achieved again.
The above-described effect of the SRT on EtS removal illustrates well that adapted microorganisms are needed to efficiently degrade EtS. A higher SRT allows: (a) acclimation time for substrate-specific enzyme activity to be turned on and, (b) the populations of slow-growing bacteria to proliferate in cases where the SRT is higher than the regeneration time. Essentially, if the bacteria of concern do not grow fast enough to replace themselves, they can be washed out with an excessively high sludge-wasting rate. When this happens, the biodiversity decreases and some specific functions of the biodegradation process are no longer supported.
Additional observations in practice.A series of other observations further underscore the importance of maintaining the needed microbial population. After the manufacturing plant that was supplying EtS to the WWTP was shut down for two weeks in May 2013 (this is indicated in Figure 3), the sludge needed about 2 weeks to again completely degrade the newly supplied EtS (see period C in Figure 3, following the feed’s EtS-depletion period).
Further, the reduced EtS removal (indicated in period D in Figure 3) corresponds well with a slightly lower SRT. Likewise, the final EtS peak around the end of May 2014 (depicted in period G in Figure 3) correlates well with the preceding 3-week period that had a reduced SRT of 20 days. Conclusively, an SRT of roughly 30 days seems to be a prerequisite for appropriate EtS biodegradation. This is one of the same order of magnitude as the SRT of approximately 3 weeks for almost complete EtS biodegradation that was reported in Ref. 7 and determined here by using a standardized OECD (Organization for Economic Cooperation and Development) 301 F respiratory test.
The short-term EtS peak in the final effluent indicated by E in Figure 3 has not yet been discussed. This peak emphasizes again the complexity inherent in biological wastewater treatment. This short-term reduced EtS removal correlates well with a shock load of aniline that reached this WWTP, which seems to have affected the EtS breakdown at that moment. A possible cause for the observed EtS set-ups (indicated with F in Figure 3) is, however, not known — once more highlighting the inherent complexity of wastewater treatment based on biological processes.
Before the removal of PVA will be discussed, it must be mentioned that after the first period A in Figure 3 of low EtS removal due to the reduced SRT, the standard applied phosphate dosing in the feed (data depicted in light blue in Figure 4) was stopped, because phosphorus-containing molecules were found at that time in the final effluent — indicating reduced biological treatment efficiency. Because of the low permitted concentration for discharge of total phosphorus from the facility, the phosphate dosing was stopped at that time.
Enabling the microorganisms
Figure 5 presents the data for the PVA follow-up (over the same time scale as the EtS followup). In the period where the EtS removal was the worst (end of 2012, beginning of 2013, corresponding to periods A and B in Figure 3), the PVA concentration in the treated water also turned out to be higher than would be the case later on during this detailed study, as indicated with A’ and B’ in Figure 5.
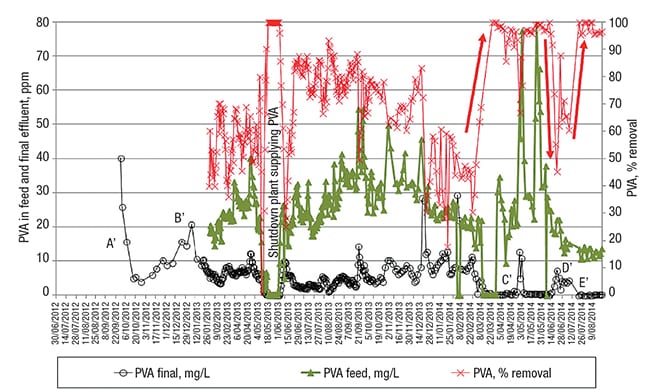
FIGURE 5. Poly-vinyl alcohol (PVA), concentration in the feed and final effluent, together with its removal efficiency. The red arrows show variations in the PVA removal induced by the PO4-P changes depicted with light blue arrow in Figure 4
One explanation for this can be found in the too-short SRT in these two periods (10 and 15 days, respectively), which caused the low EtS-removal efficiency, as discussed earlier. As is the case for EtS degradation, the system must maintain appropriately adapted, acclimated microbial populations, and this demands several weeks; a too-low SRT impedes appropriate bacterial growth in the system of “degradation specialists” with longer generation times, which have the capability to biodegrade specific target molecules, such as PVA.
The data depicted in Figure 5 demonstrate a PVA-removal efficiency varying between 50% and 80% from the beginning of February 2013 until February 2014. During this period, SRT was kept between 25 and 40 days (Note: from February on, the PVA was additionally analyzed in the feed to the WWTP). The observed variation in PVA removal could be attributed to possible small changes in the structural characteristics of the PVA, which is known to affect the activity of several PVA-degrading enzymes, and hence the rate and extent of polymer biodegradation.
Then, around the beginning of March 2014, the PVA in the final effluent fell from 2–10 ppm to a baseline of 0 ppm (see Figure 5), indicating complete removal of the PVA. This remarkable observation correlates well with the WWTP’s phosphate addition (to serve as a source of the nutrient phosphorus (P), for the microorganisms) since the beginning of February 2014. It is known that a P-to-C ratio in the feed that is too low can cause loss of treatment efficiency with activated sludge processes. Since the “optimal” ratio depends on the particular biological process, it needs to be tailored to each individual wastewater [ 5 ].
It appears that the amount of P in the feed before March 2014 was not enough to attain complete PVA removal, whereas complete EtS removal was still achieved with the lower-P system condition. The period indicated with letter D’ in Figure 5, where the PVA removal is clearly lower, confirms the need for extra P nutrient in the feed of this WWTP to ensure the complete removal of PVA. This period of temporarily reduced PVA removal correlates well with the temporary cessation of phosphate dosing that had been initiated about 20 days before. Complete PVA removal was restored again in the period marked E’ (Figure 5), after the extra P dosing was restarted.
The short-term reduction in PVA removal, as indicated with C’ in Figure 5 (April 5–19, 2014), coincides with an observed — but equally unexplained — short-term lower EtS removal. Something had caused a short-term effect on the biological working of the activated sludge, as exemplified by the lower PVA- and EtS-removal rates.
It is important for facility owners and operators throughout the chemical process industries to recognize that in addition to degradation generalists, degradation specialists are needed to design systems that will reliably biodegrade hard-to-degrade pollutants. Biological wastewater treatment is an inherently complex process. Factors such as ensuring a sufficient long sludge (SRT) age and an abundance of nutrients such as P are prerequisites to augment the biological removal of specific components.
Edited by Suzanne Shelley
References
1. Daigger, T., Ardern and Lockett Remembrance, In: Jenkins, D. and Wanner, J., Eds, “Activated sludge —100 Years and Counting,” IWA Publishing, 2014.
2. Schultz, T.E., Biological Wastewater Treatment, Chem. Eng. 112, pp. 44–50, October 2005.
3. An, L., Biological Wastewater Treatment: Selecting the Process, Chem. Eng., 120, pp. 38–43, October 2013.
4. Conn, E.E., Stumpf, P.K., Bruening, G., Doi, R.H., “Outlines of Biochemistry.” John Wiley & Sons, 1987.
5. Gray, N.F., “Biology of Wastewater Teatment, Series on Environmental Science and Management,” Vol. 4, 2nd Ed., Imperial College Press, 2004.
6. Lucas, N., Bienaime, C., Belloy, C., Queneudec, M., Silvestre, F., Nava-Saucedo, J.-E., Polymer Biodegradation: Mechanisms and Estimation Techniques: A Review, Chemosphere 73, pp. 429–442, September 2008.
7. Halter C.C., Laengin A., Al-Ahmad A., Wurst F.M., Weinmann W., Kuemmerer K, Assessment of the stability of the ethanol metabolite ethyl sulfate in standardized degradation tests, Forensic Science International 186, pp. 52–55, April 2009.
Author
 Bart Peeters is a manufacturing technologist at Monsanto Europe N.V. (Haven 627, Scheldelaan 460, 2040 Antwerp, Belgium; Phone: +32-3-568-5762; Email: bart.peeters@monsanto.com), where he has been working since 1998. Until 2004 he served as a process improvement engineer at Eastman’s PVB polymer manufacturing plant. Since then, he has been working at the environmental department of Monsanto with particular responsibilities in improving the wastewater treatment plant and the combined sludge centrifuge-dryer installation. Being a Master Black Belt, Peeters is also the Six Sigma program leader at the Monsanto Antwerp site. While working at Monsanto’s WWTP, he obtained his Ph.D. in Engineering from the KU Leuven (Belgium), on the research topic “Effect of activated sludge composition on its dewaterability and sticky phase.” He also holds an M.S.Ch.E. degree from the KU Leuven, and an M.Bio.Ch.E. degree from the university college De Nayer. He is the author of 20 papers in scientific journals, technical magazines and international conferences.
 Frank De Groof is a technology specialist at Monsanto Europe NV (Phone +32-3-568-5909; Email: frank.de.groof@monsanto.com), where he has been working in the analytical services laboratory since 1988. In his current role, he is responsible for analytical method development, troubleshooting and method validation for the different production sites at the Monsanto Antwerp location. His main analytical skills include LC and LC/MS. De Groof is a certified Six Sigma Green Belt. He received his B.S. in chemistry from the Karel de Grote university college in 1986.
 John Pugh is a research associate at Monsanto (800 North Lindbergh, St. Louis, MO; 63167; Phone: 417-496-6305; Email john.m.pugh@monsanto.com), where he has worked since 2008 as a waste-treatment process scientist. He provides laboratory support to Monsanto’s global waste- treatment facilities, including process troubleshooting, optimization, and development. He holds a B.S. in biology, (comprehensive) with an emphasis in microbiology and biotechnology. Pugh has presented research in the field of phylogenetics at regional and national conferences.