Correctly identifying flood mechanisms that limit throughput in a distillation column is central to maximizing capacity and debottlenecking. Guidelines for diagnosing the mechanism are described in Ref. 1. This column recounts a case of downcomer backup flooding.
Backup from frothy liquid
Downcomer backup flooding occurs when frothy liquid in the downcomer backs up to the tray above. Figure 1 shows the factors generating the liquid/froth backup: the tray inlet clear liquid height, plus the pressure drop across the tray above, plus the friction of liquid flow through the downcomer clearance.
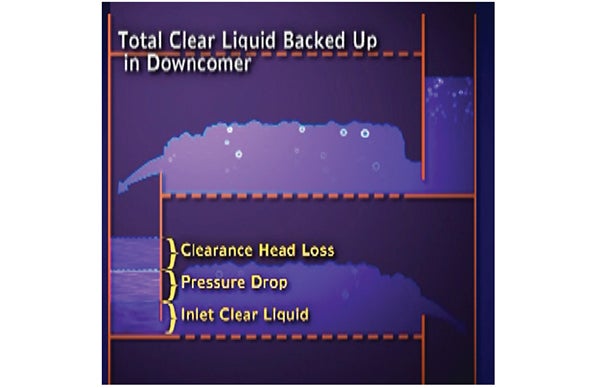
FIGURE 1. These factors cause liquid backup in a downcomer. Reprinted courtesy of Fractionation Research Inc. (FRI; Stillwater, Okla., www.fri.org)
In terms of clear (non-frothy) liquid heights (liquid heads) at high loads, typical inlet clear-liquid heights are 3–4 in., tray pressure drop 4–5 in., and friction through the clearance is 1 in. of liquid head, giving a total 8–10 in. of liquid head in the downcomer. The frothy liquid in the downcomer is typically about 60% liquid, 40% vapor. Therefore, the height of the frothy liquid equals the liquid head divided by 0.6, giving 13–17 in. To initiate downcomer backup flood, froth height needs to exceed the tray spacing plus weir height. When the tray spacing exceeds 24 in. and there is no fouling, plugging or foaming, the froth height is usually well below the flood initiation point.
Flooding at the BPA
Under those conditions, downcomer backup is an uncommon flood mechanism. However, this convention was challenged by an experienced engineer in one refinery that was experiencing downcomer backup flooding in the bottom pumparound (BPA) of its atmospheric tower.
“We have a simulation that shows the BPA operates at 120% of downcomer backup flood. No fouling or foaming there. And we have gamma scans that confirm this,” the lead engineer explained.
I inquired about the tray spacing in the BPA; 760 mm was the response.
“This is strange. I have not seen anything like this before. Can I get a copy of the simulation output and drawings of the BPA trays?” I asked.
Back in my hotel, I pored over the simulation output. In addition to the final result (120% of flood), simulation outputs also list each of the terms depicted in Figure 1. To reach downcomer backup flood, one of the terms needed to stretch well beyond the normal range. The pressure drop and inlet liquid height were within normal ranges. The clearance head loss was 8 in., which is eight times what would be expected. This can only occur if the specified clearance was small.
Sure enough, a check of the simulation input revealed a specified 4-mm clearance value. Pumparounds have relatively large liquid rates, and typical clearances are 30–60 mm, not 4 mm.
Suspecting an input error, I opened the drawing. The unbelievable hit me: the downcomer clearance on the drawing was 4 mm, exactly as the consultant running the simulation had input. The client was correct — there was indeed downcomer backup flooding.
Back at the conference the next morning, I admitted defeat: “As you correctly stated, your fractionator is experiencing a downcomer backup flood limit at the BPA.” I then added, “This flood is caused by the tiny downcomer clearance of 4 mm.”
They started to laugh. “Where did you get the 4 mm from?”
“It is here on the drawing,” I said, and pointed at the dimension.
“This is a mistake,” they replied. “The clearance is 40 mm, not 4 mm. We also saw that small dimension on the drawing and checked it thoroughly in the tower. It is definitely 40 mm.”
More trays, less space
I thought for a minute, then spoke: “In this case, you don’t have a downcomer backup flood. The only reason that you did is because your consultant input 4-mm clearance in the simulation. Had it been 40 mm, there would have been no downcomer flood.”
The room went silent. The leader said, “Let me look into it over lunch.” After lunch, the conversation resumed. “You are right. With 40-mm clearance, the simulation shows 66% of downcomer backup flood,” the leader said.
“So then why are the gamma scans showing flooding in the BPA?” the leader asked.
“This is a different question. I need to look at the scans and learn more about the tower experience,” I said.
After review, the answer became clear. Before the flooding, light diesel prices sat at about twice that of heavy diesel, so the refinery was attempting to maximize its yield. Prior to the last turnaround, a tray supplier proposed improving light diesel yield by adding trays between the BPA and the heavy diesel draw. Because this was an existing tower, the number of trays could only be increased by reducing the tray spacing.
Despite the supplier’s expectation, this initiated flooding below the BPA. The flood carried into the BPA trays. A close analysis of the gamma scans showed that the flood initiated not at the BPA, but a few trays below, where the spacing was reduced.
The Doctor’s Takeaway: When something does not look right, it is probably not right.
Edited by Scott Jenkins
Reference
1. Kister, H. Z., How to Troubleshoot Tower Floods, The Chemical Engineer, March, 2016, p. 42.