Identifying and quantifying sources of heat loss around process equipment allow plant engineers to investigate inexpensive fixes, such as pipe insulation, that can minimize operating costs
Every plant leaks heat. In some facilities, those losses quietly rank among the largest contributors to operating costs. Yet they often slip under the radar, overshadowed by bigger, flashier projects. Often, weeks are spent fine-tuning process efficiencies while the steady heat bleeding from poorly insulated lines or aging vessels is ignored.
A few years ago, the author visited a client site where operators were convinced the reboiler had “lost efficiency.” The project brief was straightforward: size the requirement and replace it with a new unit. But a quick heat-loss check of the existing network told another story — most of the missing energy was escaping through a small patchwork of outdoor, uninsulated utility lines feeding the vessels. Nearly 75% of the total loss came from bare piping. A few rolls of mineral-wool blanket would have solved what had become both an investment and an operational problem.
That kind of oversight is common. We calibrate controllers to the tenth of a degree, yet we ignore the hundreds of watts leaking through poorly insulated piping or aging vessels. The irony is that the fix is simple once we can estimate what’s really being lost.
This article outlines practical ways to quantify and reduce these hidden losses using straightforward field calculations and estimation methods. The goal is to help engineers view insulation not as a passive design detail, but as an active lever for improving energy efficiency and reducing operating costs across the plant.
Understanding the basics
Heat escapes any hot surface via three mechanisms: conduction, convection and radiation. For most plant equipment below about 300°C, conduction through insulation and convection to ambient air dominate. Radiation grows relevant at higher temperatures or for bare metal.
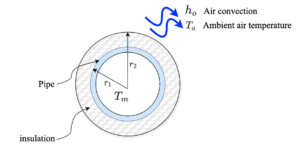
Figure 1. The diagram shows the cross-section of an insulated process pipe
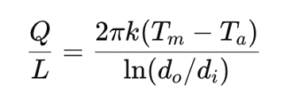
For a cylindrical surface such as a pipe, the total heat flow per unit length can be expressed by Fourier’s law combined with an external film coefficient:

where:
This is the core expression in IEEE Std 515, the reference standard for electrical heat tracing in the chemical industry. It’s simple enough to fit on a napkin but accurate enough to size tracing loads or justify insulation upgrades.
In everyday terms the following axioms are true:
- The thicker and less conductive the insulation, the lower the heat loss will be
- However, there is a point of diminishing returns — beyond roughly 50 mm on typical process lines, the incremental savings flatten out
- For small pipes, critical thickness (where convection overtakes conduction) is just a few millimeters, so the insulation thickness is almost never a practical limit.
As a quick check, every 10°C surface excess leaks on the order of 40–150 W/m², depending on air film (indoor still air versus outdoor wind). A few meters of hot pipe can equal the heat loss of a small radiator.
Heat loss from vessels and other fluid-containing equipment follows the same basic principles, although the complete calculation is more involved and beyond the scope of this article. Vessel losses are more complex because of heat bridges created by nozzles, supports and other penetrations through the insulation. In most cases, a more detailed analysis is needed to estimate total losses accurately, and it’s best to consult the equipment or insulation supplier for those evaluations.
Practical estimation methods
The following are two approaches for estimating heat loss.
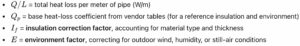
Rule-of-thumb (datasheet) approach. Most engineers first meet heat-loss estimation through vendor tables — like the Chromalox Design Guide. Engineers can select a pipe size, insulation thickness and surface-temperature difference (ΔT), then read a corresponding correction factor (for insulation type) and environment factor (outdoor or indoor):
where:
It’s quick, convenient and close enough for routine sizing. But it’s limited to discrete data points. When your conditions fall between table entries, interpolation — or guesswork — creeps in. And units often require conversion between metric and imperial systems, a perennial source of small but compounding errors.
Use this method when you need a ballpark number for budgeting or feasibility screens, not for fine tuning or reporting to corporate sustainability teams.
Analytical (IEEE 515) method. The IEEE 515 method improves accuracy by keeping the underlying heat-transfer physics explicit. In practical use, one simplified form omits the external convective resistance term — a reasonable approximation that remains conservative for most insulated lines. The resulting expression for heat loss per unit length is:
where:

Typical k values (W/m·K):
|
Materials |
k (W/m.K) |
|
Mineral Wool |
0.045 |
|
Fiberglass |
0.038 |
|
Polyurethane |
0.030 |
|
Aerogel |
0.020 |
Example insulation savings calculation:
A 4-in. (114 mm) carbon-steel line carries a 150 °C stream through 25 °C air. With 50 mm mineral-wool insulation (k=0.045), results in approximately 56 W/m.
An uninsulated pipe of the same size would lose roughly 517 W/m (assuming an external air-film coefficient of 10 W/m²·K). So one 10-m section saves ~4.6 kW — about 111 kWh per day. At $0.07 /kWh, that’s nearly $2,827 per year — per line.
Multiply by a few dozen hot lines, and the “boring” insulation job suddenly beats many debottlenecking projects for return on investment (ROI).
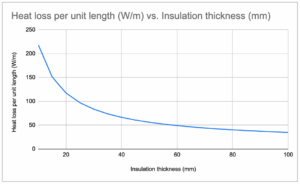
Figure 2. The graph shows heat loss per meter versus insulation thickness for 4-in. pipe, showing diminishing returns beyond 70 mm
Field validation
Even the best equations need ground truth — and that’s where field measurements come in. Infrared thermography and surface temperature logging turn abstract calculations into actionable data.
Modern handheld IR cameras — or even compact smartphone attachments — can scan hundreds of meters of piping in minutes. Hot spots stand out immediately, revealing missing insulation, damaged jacketing, or moisture-laden sections that conduct heat far faster than they should. These images don’t just confirm losses; they help rank maintenance priorities by showing which areas bleed the most energy.
A simple gray pipe may look harmless to the eye, but on a thermal image it often glows with color gradients that tell a different story. The visual feedback is powerful: where the camera shows bright, the plant is paying for wasted heat. Some facilities may now pair periodic thermographic surveys with maintenance planning, using surface temperature maps as a preventive tool rather than a diagnostic one.
Insulation choices
Not all insulation is created equal.
- Calcium silicate handles up to 650°C and is suited for steam lines.
- Fiberglass and mineral wool serve mid-temperature services below 250°C.
- Polyurethane and aerogel composites shine in cryogenic or high-efficiency applications.
Whatever the material, moisture intrusion is the silent killer. Wet insulation conducts heat two to four times faster than dry. Periodic inspection of jacketing, seals and drainage is as vital as thickness itself.
Together, these simple estimation tools and field checks can quantify losses quickly enough to justify maintenance actions before they compound into significant energy costs.
Closing thoughts
Insulation rarely draws attention. No one celebrates a freshly lagged pipe rack, yet few upgrades deliver such consistent returns. Properly maintained insulation lowers both operating costs and emissions — and it does so without introducing process risk.
If you can measure your heat losses, you can manage them. So when energy consumption starts to rise, it’s worth checking the simple things first. A quick scan with an infrared camera often reveals the quiet culprits — valves, flanges, or bare sections radiating heat into the air. They don’t make noise, but they do cost money, steadily and predictably, until they’re corrected.
Edited by Scott Jenkins
References
- Chromalox, Inc., Heat Trace Design Guide (AE Edition) — Design and Application Guide for Heat Tracing Systems, Pittsburgh, PA (2020).
- IEEE, IEEE Std 515 2017 — Standard for the Testing, Design, Installation, and Maintenance of Electrical Resistance Trace Heating for Industrial Applications, Institute of Electrical and Electronics Engineers, New York (2017).
- Chhabra, R. P., and Shankar, V., Coulson and Richardson’s Chemical Engineering, Vol. 1B: Heat and Mass Transfer — Fundamentals and Applications, Seventh Edition, Elsevier, Oxford (2018).
- Çengel, Y. A., and Ghajar, A. J., Heat and Mass Transfer: Fundamentals & Applications, Fifth Edition, McGraw-Hill Education, New York (2015).
Author

Patrick Samuel is a French chemical engineer specializing in process design and EPC projects with a focus on clean manufacturing and industrial innovation. He has extensive expertise in plant design, process simulation, distillation, solvent recovery, thermal optimization, and operational efficiency, and is a certified Lean Six Sigma Black Belt. Patrick has delivered major industrial projects for global companies, improving both environmental compliance and production performance. He holds a Master of Engineering in Chemical Engineering from the École Nationale Supérieure des Industries Chimiques and is a recipient of the Norbert Ségard Young Hope Innovation Prize. Connect with him on LinkedIn: linkedin.com/in/samuelpatrick