In the long run (a few hundred years, perhaps) humans will exhaust the Earth’s current supply of fossil fuels. It is more accurate to say that before we exhaust the supply, humans will stop burning fossil fuels to produce electricity and power our vehicles because fossil fuels will have become too valuable. From a chemical engineering perspective, would it not be more appropriate to use fossil fuels as feedstocks for chemicals, rather than burning them for fuel? Answering that question requires an understanding of the future prospects for each of the currently used energy sources.
A detailed analysis of each fuel type could fill a book — or maybe even a large library. The following article briefly summarizes the commonly held wisdom of reserve ranges for each non-renewable fuel, and the factors that may affect their use.
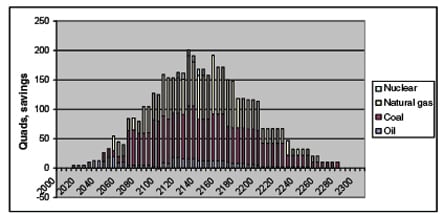
Figure 1 shows the general trends of energy production and projected use for the next three hundred years. The absolute numbers in any given mid-term year can be questioned, but the near-term numbers, say the next twenty years, are predictable, and the increasing percentage attributable to renewables in the long-term is inevitable.
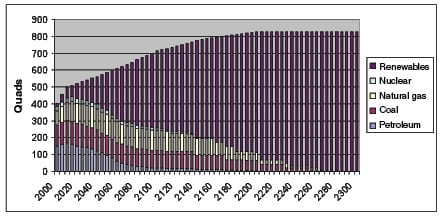
For reference, a Quad is one quadrillion British Thermal Units (BTUs). A Quad is also approximately 25 million tons of oil equivalent.
Petroleum
BP plc (London, U.K.; www.bp.com) annually publishes a statistical analysis of energy reserves, production and consumption [1–4]. One interesting measure is the reserve to production ratio (R/P), defined as the reserves remaining at the end of any given year divided by the production for that year. The result is the length of time those remaining reserves would last if production were to continue at that rate. Since the mid-1980s, BP has reported the world R/P ratio for hovering around 40. The BP 2011 report lists the world oil R/P ratio at 46. According to those figures, one might conclude that petroleum reserves have increased over the years to keep up with increased production. But despite those numbers, that conclusion is more difficult to make than it would seem.
While production numbers are easy to count and easy to verify, reserves in many parts of the world cannot be independently checked. A certain amount of trust is required to believe the reserves reported by Middle East petroleum producers, including Saudi Arabia.
What if reserves don’t keep up with production? Of the world’s four supergiant oil fields, three are in decline, and the largest (Ghawar) is estimated by Saudi Aramco at approximately 50% of its original recoverable reserve. Ghawar, discovered in 1951, produces approximately 6% of the world’s oil, but salt water is pumped into the field in ever-increasing amounts to maintain production levels. Currently, the oil pumped from Ghawar contains 55% salt water. If Ghawar is in decline, along with the other three well documented supergiant fields, then BP’s R/P ratio may be suspect.
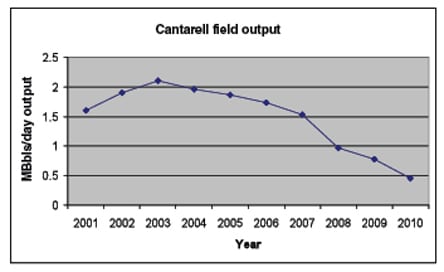
The decline of Cantarell in Mexico, previously the world’s second largest producing field, has been remarkable. Its production fell from a peak of 2.1 million bbl/d in 2003 to just 0.5 million bbl/d in 2010.
Even more troubling, the world’s overall oil R/P ratio itself may be declining. But why then does Figure 1 show a hundred years of remaining oil production? As oil reserves become more difficult and expensive to produce, the price increases and substitutes must be found. The final depletion of oil can, therefore, take decades.
 |
Another sign of reserve trouble is the difficulty oil exploration companies have in finding and producing oil. Not only do companies drill six miles down under one mile or more of the ocean, they also tend to produce heavier crude with higher sulfur levels. Light, sweet crude oils now command large premiums.
Coal
The R/P ratio can be applied to coal as well. The BP 2008 report lists the world coal R/P at 131. That means 131 years of coal are left, assuming we don’t find any more reserves and the world keeps producing coal at the 2008 level. But the BP 2011 report lists the world R/P level at 118. What happened? In four years, the R/P ratio dropped by 13 years. Taken at face value, this indicates reserves have not kept pace with increasing global production and use. The 2011 report shows an increase in coal consumption, but in world energy production overall, coal and oil are both losing market share to natural gas and renewable energy. In the U.S., coal market share for the first quarter of 2011 dropped to its lowest point in 30 years, according to the Energy Information Administration (EIA; Washington, D.C.; www.eia.gov), to 46% [5].
Coal-based energy is surrounded by thorny political issues, including air-toxic contaminants, criteria pollutants (ozone, lead, particulate matter, carbon monoxide, sulfur dioxide and nitrogen oxides) and greenhouse gas emissions. Permitting and plans for building new coal-fired power plants have ground to a near halt. Further, in efforts to refurbish 30- to 40-year-old power plants, utility companies face U.S. Environmental Protection Agency (EPA; Washington, D.C.; www.epa.gov) New Source Review action if they try to perform “repairs” without installing state-of-the-art emission controls. Historically, these emission controls covered NOx, SOx, particulate matter and mercury. A new incarnation of EPA’s Clean Air Interstate Rule (CAIR), called the Cross-State Air Pollution Rule (CSAPR) was finalized in July 2011. CSAPR requires sources in 27 states to reduce power plant emissions of NOx and SOx to control ozone and fine particulate matter in downwind states. A utility-sponsored study concludes that implementing the rule would lead to a major drop in coal-fired power generation.
While ozone and particulate controls are expensive, technology for carbon capture and storage is even more complex and costly. Carbon capture to mitigate CO2 emissions also impacts power plant efficiency, and the longterm dumping of sequestered carbon in underground formations is of questionable effectiveness. Overall, the carbon capture technology significantly raises the cost of burning coal and building coal-fired power plants. The mere threat of carbon capture regulatory requirements may be enough to limit coal operations. For U.S. electric utilities, the introduction of costly new emission controls coupled with the new-found abundance of low-cost natural gas has contributed greatly to the decline of coal [6].
There is also an interplay between regulations and the different types of coal that predominate at different locations. For example, Wyoming coalmines produce more coal than the next seven U.S. states combined [7]. Wyoming coal is sub-bituminous, while almost all other coal is bituminous (the rest is a smattering of lignite and anthracite). Besides the lower heat content, Wyoming’s Powder River Basin coal is transported by rail over long distances to reach its markets. Luminant, a Texas-based utility announced September 2011 it would idle two coal-fired power plants and switch another plant from Texas lignite to lower-sulfur Wyoming sub-bituminous to comply with CSAPR [8].
Natural gas
Just a few years ago, projected natural gas shortfalls in the U.S. led to hasty plans for building liquefied natural gas (LNG) terminals at shipping ports to import the resource. At the time, the price of natural gas per million Btu (MMBtu) soared, and coal and nuclear power looked like the only options to meet the world’s energy demand. But recent technology improvements and wider use of hydraulic fracturing (fracing) and directional drilling of shale deposits has meant a higher domestic supply of natural gas in the U.S. No supply shortfalls are projected. It is even conceivable that the U.S. could invest in LNG infrastructure for exporting.
Sometimes called unconventional gas, natural gas produced from shale deposits has been, and remains, a highly contentious issue. Tension continues due to potential environmental-impact issues related to groundwater contamination by fracing fluids. Doubts also linger over the longterm production capacity of these new fields. Will they deplete quickly, like Mexico’s Cantarell oilfield, or have the lasting power of Saudi Arabia’s Ghawar?
While historically volatile, the price of natural gas appears to have gained stability and will likely remain low for the foreseeable future. Compared with permitting a coal-fired power plant, permits for a natural gas, combined-cycle power plant are relatively easy to obtain, and construction can be completed in as little as two years. Those factors explain most of natural gas power plants’ dominance in incremental new power generation capacity in the U.S. over the last few years. Power generation capacity from wind has been the other winner.
World R/P for natural gas, according to BP, is 58 years, which would seem to be very robust. However, natural gas is not as easily transportable as oil, and much of the historically proven natural gas reserves are in locations where transportation is necessary for the gas to be usable. The U.S. leads the world in total natural gas production, but BP reports that the U.S. R/P is only 12.6 years. This would seem to be a contradiction, but possibly fracing will boost the R/P ratio. For example, EIA now reports the U.S. potential natural gas reserves at 2,552 trillion cubic feet (Tcf), and an industry group, the Potential Gas Committee, reports reserves at 1,898 Tcf. These figures are nearly an order of magnitude greater than the 272 Tcf of proved reserves listed in the 2011 BP report. If the potential reserves are converted to proved, the R/P ratio for the U.S. improves to approximately 100. Significantly, other parts of the world, such as Europe, also have major deposits for shale gas extraction. And the potential bonanza doesn’t stop there. Even deeper shale fields exist below those currently being tapped that may increase the potential reserves significantly.
Another potential source of methane, the primary ingredient of natural gas, are clathrate deposits (methane hydrate crystals) under sediments at the bottom of the ocean near continental shelves. At one time thought to be an enormous potential resource, estimated at roughly twice the known reserves of natural gas, deposits are low in methane concentration and may not be economic to extract. Production research is still in the early phase.
The new abundance of natural gas, in addition to significantly damping the economics of coal and nuclear power plant construction, may also negatively impact construction of renewables projects. However, one hundred years of reserves is still only one hundred years. Before this new boost in reserves, the Figure 1 curve for natural gas would have been quite a bit lower and would have shown earlier depletion than it currently does.
Nuclear
The nuclear disaster in Fukushima continues to cast a large shadow over nuclear power. Opinions about the impact of the event range from Fukushima having no impact on the future of nuclear power generation, to Fukushima sounding the death knell for nuclear power. There is general agreement that the Fukushima event will negatively impact siting and design cost. Germany has renounced all nuclear power production. Plans in the British market are bleak. Construction of new nuclear power plants in the U.S. is at a dead stop and seems bleaker than the dim outlook for coal power plants.
One of the stalwarts of the nuclear industry is France. In September 2011, an explosion at a French nuclear waste treatment facility killed one worker and injured four others. Will this accident impact nuclear sentiment? Possibly. Demonstrations against nuclear power plants are now popular in France.
 |
Whatever the impact, nuclear power accounts for only 7% of world energy production, and is unlikely to become a major contributor to world energy production in the next twenty years. Even with a nuclear power renaissance, it would be difficult predict that nuclear power would account for more than 10–15% of world energy production in the next hundred years. Add to that the emergence of abundant and low-cost natural gas, and a nuclear renaissance is highly unlikely.
Population-energy link
In the U.S. and other developed countries, per capita energy use is on the decline, but the reverse is true for per capita energy use in China and India. Coupled with population growth in those regions, the increased energy usage is ominous, and puts tremendous pressure on those governments to develop new sources of energy, both domestically and internationally.
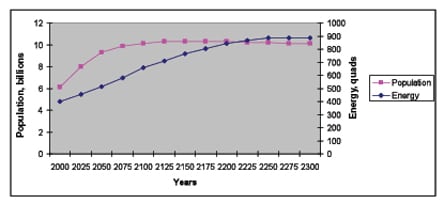
A strong case can be made that globally, energy demand growth is a function of population growth. In developing countries, though, per capita energy demand growth in developing countries is the primary driver.
 |
 |
As world population grows, resources, such as food and water, will require an increasing amount of energy to process, especially in the use and production of reverse osmosis filtration systems, fertilizer and other technologies.
100% renewables
A study by the National Renewable Energy Laboratory (NREL; Golden, Colo.; www.nrel.gov) shows that the grid can take a penetration of up to 35% renewable power generation without much in the way of incorporating grid compensation techniques such as energy storage or natural gas peaker turbines [9–10]. A higher penetration rate requires grid-level energy storage, such as compressed-air energy storage, pumped hydro, large MW-scale batteries, or millions of electric vehicles (see Transporting Energy through Time; Chem. Eng., December 2011). NREL is rumored to be working on a study evaluating the implications of generating 80% of U.S. energy from renewable sources.
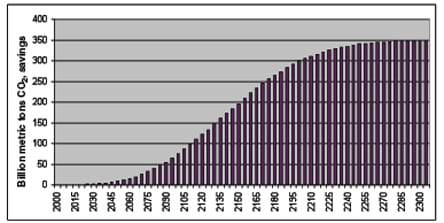
Accelerating the use of renewables not only would allow future generations to use natural gas, coal and oil for valuable products, rather than for combustion, it would also enhance reductions in CO2 (Figures 4 and 5). The cumulative reduction of CO2 compared with the Figure 1 baseline scenario is shown in Figure 6. The Figure 1 scenario in itself provides a path to an aggressive reduction in CO2 emissions.
Could we ever produce 100% of our energy from renewable sources? Three great resources address this question in detail [11–13]. The answer seems to be that there would be regional challenges to adopting renewable energy technologies for all energy produced, and that the balance would have to made up in regions with conditions more conducive to widespread use of renewable resources.
Because of fast-changing geopolitical factors, the problem of energy supply is more pressing and potentially more disruptive in the short-term, compared to the longer-term concern over the effects of climate change due to global warming. The race is on to replace oil as the fuel of choice for transportation, and the only question is whether we will reduce our usage before a calamity strikes (for example, the Ghawar oilfield runs out of oil or Iran shuts down production). In developing countries and developed countries who are not net oil importers, this fear, as much as economic forces, has driven the rise in development of alternative energy technology.
What if we develop renewables on an accelerated basis? Market forces have already made the cost of many renewables attractive, and this will become only more pronounced. For example, wind and natural gas have accounted for virtually all the incremental power generation in the U.S. for the last few years (2008–2011). Construction has begun on several hundred-MW-scale solar plants in the U.S. desert southwest. Geothermal and hydroelectric have also begun to gain traction [14]. According to the Bloomberg New Energy Finance report, investment in renewable energy in 2010 surpassed investment in fossil fuels for the first time ($187 billion for renewables; $157 billion for fossil fuels).
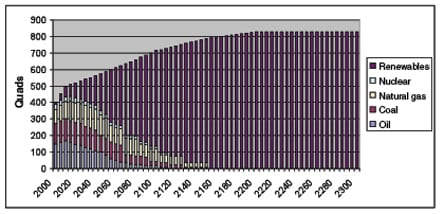
But how could we accelerate the expansion? Many people find government intervention distasteful. For example, a carbon tax law passed in Australia in October 2011 is highly contentious. However, some enhanced incentive system for renewable energy sources along the lines of the Production Tax Credit (PTC), combined with a disincentive system for combustion fuels, could drive accelerated development. Innovative electric utility power purchase agreements, or PPAs, may serve to accelerate renewables penetration, and even suppress ratepayer costs via the traditional auction “stacking” method. Figure 4 shows what accelerating the development of renewable power generation would do to the requirement for oil, coal, natural gas and uranium.
Instead of planning for complete depletion of oil, coal and natural gas, developing renewables on an accelerated schedule saves these valuable commodities for future generations (Figure 5), which was calculated by subtracting the oil, coal, natural gas and nuclear amounts in Figure 4 from those in Figure 1.
Present value; future benefit
The estimated net present value of energy savings from accelerated renewables usage (excluding nuclear) is approximately 550 quads (Figure 5), which is also only one year of energy use in the 2020 time frame. This calculation assumes 2% annual energy usage growth over the next hundred years, slowing to 1%, then 0.5%, then leveling off as shown in Figure 1. The fossil fuel area under the Figure 5 curve, however, is about 4,500 quads. This means if we accelerate our investment in renewables (and nuclear, if possible), we can preserve 4,000 quads worth of carbon for future carbon-intensive products.
Figure 5 also shows other benefits: the massive savings of coal carbon emissions and water. Switching away from conventional power plants to renewable energy sources would conserve water resources to a significant extent. According to a report from the Energy Information Agency [15] (www.eia.gov) that cites data from the U.S. Geological Survey, electric power plants (coal, gas and nuclear) account for nearly half of the water withdrawn from reservoirs and aquifers in the U.S. Use of renewable power plants would greatly reduce this water draw. The role of renewables and natural gas is discussed in the sidebar on the plan to curb greenhouse gas emissions.
Fuel-switching strategies
Energy for electric power — Tackling the critical question of which fuels to use for electric power production can be helped by understanding the overall lifecycle cost of various energy sources as well as the longterm sustainability of that fuel source.
One tool to evaluate the total lifecycle cost of power production is energy return on investment (EROI). EROI is typically calculated by dividing the energy output over the lifetime of the source by the energy required to develop the source — in other words, how many BTUs are required to produce the fuel, versus how many BTUs you are able to harness by burning it.
EROI calculations are somewhat controversial, with some questioning the validity of comparing the EROI of one technology with another. In cases where an exact and detailed comparison is required, the concern over comparing different technologies by EROI is probably justified. However, if EROI is simply calculated as as a more qualitative indicator — for example, to determine whether EROI is trending up or down longterm, or whether EROI for a given technology is closer to 20 or 1 — it yields fascinating comparisons. For example, in the early days of crude petroleum drilling (1800s), oil could be picked up in buckets laying in pools in Pennsylvania. The EROI for oil under those conditions would have been on the order of 100 to 1. Today, the EROI for crude oil globally is on the order of 10 to 1.
Alternative methods to produce power such as hydroelectric, geothermal, wind, solar and ocean are sustainable in the longterm, but must be carefully evaluated against EROI. The EROI for solar energy, for example, was once thought to be less than one, meaning that the energy to process silicon into photovoltaic cells, as well as install, operate, and maintain the solar arrays cost more than the energy captured by the arrays over their lifetime. Now, depending on the technology, the EROI for solar is on the order of 5–10. Wind generation EROI is on the order of 20–30. Both EROIs are increasing as technology advances, which is in the right direction. Converting corn to ethanol, on the other hand, has an EROI of about 1, which is not effective for energy purposes alone. While some people have debated whether the corn-to-ethanol EROI is slightly more than one or less than one, the answer probably doesn’t matter. Any energy source with an EROI of less than 5 is not likely to be economically viable against stronger competition on the global market. One exception would be energy for mission-critical use, where EROI is of secondary importance (jet fuel, for example) where electrification isn’t currently an option. Here, biofuels, such as algae and biowastes, may be a viable alternative if the economics play out.
A good source for discussion of EROI is the website of Charles A. S. Hall at the State University of New York [16].
Energy for transportation — Determining longterm solutions for transportation fuels may not be as difficult as energy for power production. At current production rates, the supply of oil is perilously close to its limit, in terms of meeting global demand. The global recession has provided a reprieve by reducing demand somewhat, but oil exploration has not located more “elephant” fields, and increased demand from China and India will eventually drive oil prices skyward once again. To meet anticipated global demand, as well as for other reasons, our society needs to replace oil as a source of transportation fuels. The U.S. Department of Defense takes this fuel switching strategy seriously. In September 2011, the White House announced a program to completely electrify transportation at Los Angeles Air Force Base.
Several choices seem clear in the short term (next 50 years or so). We will need to electrify our transportation, convert to natural gas or develop biofuels capability. Electrification and natural gas require extensive infrastructure buildup, though the argument for electrification infrastructure is compelling when compared to the cost of natural gas infrastructure. Biofuels, which can be carbon-neutral, provide an alternative fuel for air travel, shipping and trains.
Electric passenger cars and other light-duty electric vehicles have yet to fully overcome some of the barriers to their widespread use — including that electric vehicles have limited range, that the batteries are too expensive, and that charging electric vehicles will have a major impact on the power grid. But over the time period of the next decade, even those arguments against electric vehicles are weak [17]. When oil production can’t meet world demand, those arguments will have evaporated. Evidence for this is that automotive manufacturers worldwide are introducing electric vehicles (hybrids, plug-in hybrids, pure electrics) to the market.
Getting from here to there
One potential play would be to combine natural gas and renewables to replace coal and oil in the next 50 to 100 years. This type of hybrid plant has been demonstrated extensively with large-scale solar (the Solar Energy Generating Systems, or SEGS, near Kramer Junction, California). Hybrid facilities serve to firm the non-dispatchable, intermittent nature of pure renewables such as wind and solar. This would reduce CO2 emissions, while acting as an interim step to 100% renewables.
 |
Some may deny the possibility of a 100% renewables scenario in as little as 300 years, or ever. Yet, our non-renewable fuels are non-renewable, finite. From a chemical engineering perspective, burning oil for transportation, and coal and natural gas to produce power is akin to blasphemy. Whatever happened to using natural gas as a polyethylene feedstock? Or for pharmaceuticals? Or for polar fleece? It brings to mind the immortal line from Mike Nichols’ 1967 film “The Graduate” — “I have one word for you: plastics.”
Global Warming
Efforts aimed at solving the problem of global warming with too narrow a focus may not optimize resource use and program effectiveness. Reframing the global warming issue in the context of global energy production casts a different solution set on both energy and global warming.
The greatest contributors to global warming — based on emissions inventory methodology — are fuel combustion (for transportation, coal-fired power plants, other carbon emissions), coupled with a decreased inventory of carbon sinks, such as forests.
The popular general strategy has been to increase the use of renewable energy technologies and decrease the use of coal and oil. This “motherhood-and-apple-pie” strategy sounds reasonable, but unless it is executed within a wider context of market forces, the strategy has little likelihood of success.
Lower use of coal and oil requires increased use of other energy sources, including nuclear, natural gas and renewable technology, as well as increased deployment of energy storage technologies and an upgraded power grid. Currently, nuclear power is a relatively minor contributor to world energy, but to make a transition from fossil fuels to renewable energy, we will need every energy source available. And to replace coal and oil, we are left with a lot of cheap natural gas, developing renewable technologies and aging nuclear plants.
While natural gas combustion does emit CO2, it does so at a much lower rate per BTU than coal or oil. Table 1 shows CO2 emissions as a function of MW-hr electricity production. While this is an excellent comparison between natural gas and coal, oil isn’t used much for power production in the U.S. However, the table shows that oil emits approximately 50% more CO2 than natural gas on an effectively levelized power basis.
| Table 1. Fuel combustion CO2 emissions per MW-hr, per BBtu | ||||
| Fuel | wt. %Carbon | BTU/lb | lb CO2/MW-hr* | lb CO2/BBtu** |
| Natural Gas (typical) | 75 | 21,000 | 1,135 | 117,000 |
| Oil | 87 | 18,500 | 1,672 | 164,000 |
| Coal | 35–86 | 11,500 | 2,249 | 208,000 |
| * References 18, 19, 20 | ||||
| ** Reference 21 | ||||
The way forward, by the numbers
The relevant parameter when comparing fuel types is conversion efficiency. For example, coal-fired power plants worldwide average about 30–33% fuel-to-electricity efficiency. New coal power plants are reported to approach the mid-40% range in efficiency, possibly going as high as 50%. However, to reaching these efficiencies is expensive, because exotic turbine materials and very high steam pressures are necessary. The efficiency of a natural gas combined-cycle power plant, in contrast, is about 60%. Whether natural gas power plants replace coal, or new coal power plants are added, the end result is a decrease in pounds of CO2 per megawatt-hour.
By comparison, oil is terribly inefficient relative to CO2 emissions. One measure of this is the “well-to-wheels” efficiency for a transportation fuel, which is on the order of 15–20% for gasoline and diesel fuel. A good resource for this discussion is the Argonne National Laboratory Greenhouse Gases, Regulated Emissions, and Energy use in Transportation (GREET) model [22]. Electric vehicles are approximately two- to three times more efficient than gasoline or diesel, which is manifested in the much lower fuel cost per mile for electric vehicles [23].
Edited by Scott Jenkins
References
1. BP p.l.c. Statistical Energy Review 2011. [Internet] 2011. [cited October 2011] Available from: www.bp.com/assets/bp_internet/globalbp/globalbp_uk_english/reports_and_publications/statistical_energy_review_2011/STAGING/local_assets/pdf/statistical_review_of_world_energy_full_report_2011.pdf.
2. BP p.l.c. Statistical Energy Review 2010. [Internet] 2010 [cited October 2011] Available from: www.bp.com/liveassets/bp_internet/globalbp/globalbp_uk_english/reports_and_publications/statistical_energy_review_2008/STAGING/local_assets/2010_downloads/statistical_review_of_world_energy_full_report_2010.pdf.
3. BP p.l.c. Statistical Energy Review 2009. [Internet] 2009 [cited October 2011] Available from: www.bp.com/liveassets/bp_internet/globalbp/globalbp_uk_english/reports_and_publications/statistical_energy_review_2008/STAGING/local_assets/2009_downloads/statistical_review_of_world_energy_full_report_2009.pdf
4. BP p.l.c Statistical Energy Review 2008. [Internet] 2008 [cited October 2011] Available from: www.bp.com/liveassets/bp_internet/china/bpchina_english/STAGING/local_assets/downloads_pdfs/statistical_review_of_world_energy_full_review_2008.pdf
5. Energy Information Agency, U.S. Dept. of Energy. [Internet] 2011. [cited October 2011] Available from: www.eia.gov/cneaf/coal/page/acr/acr_sum.html
6. “AEP Sees $6–8 Billion Tab to Convert Coal Plants,” Oil & Gas Journal. June 2011. Available from: www.ogj.com/articles/2011/06/aep-sees-6-8-billion.html
7. Energy Information Agency, U.S. Dept. of Energy. [Internet] 2011 [cited October 2011] Available from: www.eia.gov/todayinenergy/detail.cfm?id=2391
8. Luminant to Idle Two Coal Units, Implement Derates on CSAPR Compliance Concerns.” Power Magazine. September 14, 2011 online issue. Available from: www.powermag.com/POWERnews/4011.html
9. Lew, D. et al., Western Wind and Solar Integration Study, National Renewable Energy Laboratory (NREL), December 2010. Available from: www.nrel.gov/wind/systemsintegration/pdfs/lew_western_wind_integration.pdf
10. Baldwin, S. Renewable Electricity Futures: Challenges and Opportunities. Solar Program Review, U.S. Department of Energy, 2010. www1.eere.energy.gov/solar/review_meeting/pdfs/prm2010_plenary_ren%20elec%20futures_baldwin.pdf
11 Jacobson, M. and Delucchi, M. “Providing all global energy with wind, water, and solar power, Part I: Technologies, energy resources, quantities and areas of infrastructure, and materials.” Energy Policy 39. December 2010, 1170–1190.
12 M. Delucchi and Jacobson, M. Providing all global energy with wind, water, and solar power, Part II: Reliability, system and transmission costs, and policies. Energy Policy 39 December 2010.
13 MacKay, D., “Sustainable Energy without the Hot Air.” UIT Cambridge Ltd. 2009. Available from: www.withouthotair.com/about.html
14. Maize, Kennedy, “Hydro: The Forgotten Renewable Rebounds,” Power Magazine. July 2011.
15. Energy Information Administration, U.S. Dept. of Energy. [Internet] November 17, 2011 [cited November 2011] Available from: www.eia.gov/todayinenergy/detail.cfm?id=3950#?src=email
16. Hall, Charles, A. S., S. Balogh, and D. Murphy, “What is the Minimum EROI that a Sustainable Society Must Have?,” Energies 2, 25-47. 2009. doi:10.3390/en20100025 2009
17. Markel, T., Mai, T. and Kintner-Meyer, M. Transportation Electrification Load Development for a Renewable Future Analysis. NREL whitepaper. [Internet] 2010. [cited November 2011] Available from: www.nrel.gov/docs/fy11osti/49181.pdf
18. U.S. Environmental Protection Agency (EPA). Clean Energy Webpages. [Internet] 2011. [cited November 2011] Available from: www.epa.gov/cleanenergy/energy-and-you/affect/coal.html
19. EPA Clean Energy webpages. [Internet] 2011. [cited November 2011] Available from: www.epa.gov/cleanenergy/energy-and-you/affect/oil.html
20. EPA Clean Energy webpages. [Internet] 2011. [cited November 2011] Available from www.epa.gov/cleanenergy/energy-and-you/affect/natural-gas.html
21. EPA Clean Energy webpages. [Internet] 2011. [cited November 2011] Available from: http:www.epa.gov/cleanenergy/energy-resources/refs.html#coalplant
22. Argonne National Laboratory. Transportation Technology R&D Center [Internet]. 2011. [cited November 2011] Available from: greet.es.anl.gov/
23. “Volt, Leaf tests show electric cars costs less per mile to operate.” Consumer Reports, online version. December 8, 2011. [Internet] 2011. [cited December 2011] Available fromhttp://news.consumerreports.org/cars/2011/12/leaf-volt-tests-show-electric-cars-cost-less-per-mile-to-operate.html
.
Author

Charles Botsford is a professional chemical engineer (Email: botschas@gmail.com) in the State of California with 30 years experience in engineering process design, distributed generation, and environmental management. He has a wide range of experience relative to oil refining, power electronics, renewable energy systems, electric vehicles, and air quality issues. Botsford is a Qualified Environmental Professional (QEP) Emeritus. Botsford holds a bachelor’s degree in chemical engineering from the University of New Mexico, and a master’s degree in chemical engineering from the University of Arizona.