This article describes an approach that uses data analytics for finding and addressing root causes of process deviations that reduce energy efficiency in key plant utility systems, and shares three case examples
Discussion about climate change has been taking place for many years and is perhaps more relevant today than ever before. This debate has led to global initiatives to reduce the carbon footprint of chemical process industries (CPI) facilities, which is high on the agenda of nearly every country. Regulations have been established on a global, regional and local scale to reduce greenhouse gas emissions, and these regulations heavily impact CPI process operators. To achieve mandated emissions-reduction goals and demonstrate regulatory compliance, many CPI companies are adopting the ISO 50001 standard, which aims to improve the organization’s energy performance and make reduction of climate change a key part of their corporate strategy.
BASF Corp. recently articulated this concept as core to its own operating strategy when it wrote: “For us, energy efficiency is the key to combining climate protection, conservation of resources and competitive economic advantages [1].”
Reducing an industrial facility’s carbon footprint is not only good for the environment, it’s good for the bottom line, as well, because sound energy management often contributes to more efficient operation, reduced fuel usage and improved overall profitability. Within the CPI, energy use is often one of the largest components of a company’s overall expenditures.
Using concerted energy-management strategies to reduce costs is not new, but has become more important due to mandated regulations and leaner profit margins in many sectors. Most CPI companies have formalized energy-management programs and use various automation and control technologies to help minimize energy costs. It is clear, however, that many process operators need to take their efforts to the next level, by monitoring and optimizing energy use in real time, and leveraging data generated via the Industrial Internet of Things (IIoT).
For many years, process data have been captured in data historians. Such data are valuable and need to be unlocked and leveraged for continuous improvement in efforts to lower the carbon footprint of the company. In recent years, advanced data-analytics techniques have been used by some large companies, to help optimize their larger onsite energy-related issues.
However, such time-consuming, centrally led, data-modeling projects are typically less well-suited for process-related optimization efforts that are carried out more locally and require subject matter expertise. More recently, the availablilty of tools that put advanced analytics capabilities in the hands of subject matter experts (SMEs), such as process and field engineers, has helped to bring these powerful capabilities to the plant and process level. In some cases, this allows SMEs to manage as much as 80% of energy-related improvements that will contribute to corporate goals for reducing the company’s overall carbon footprint.
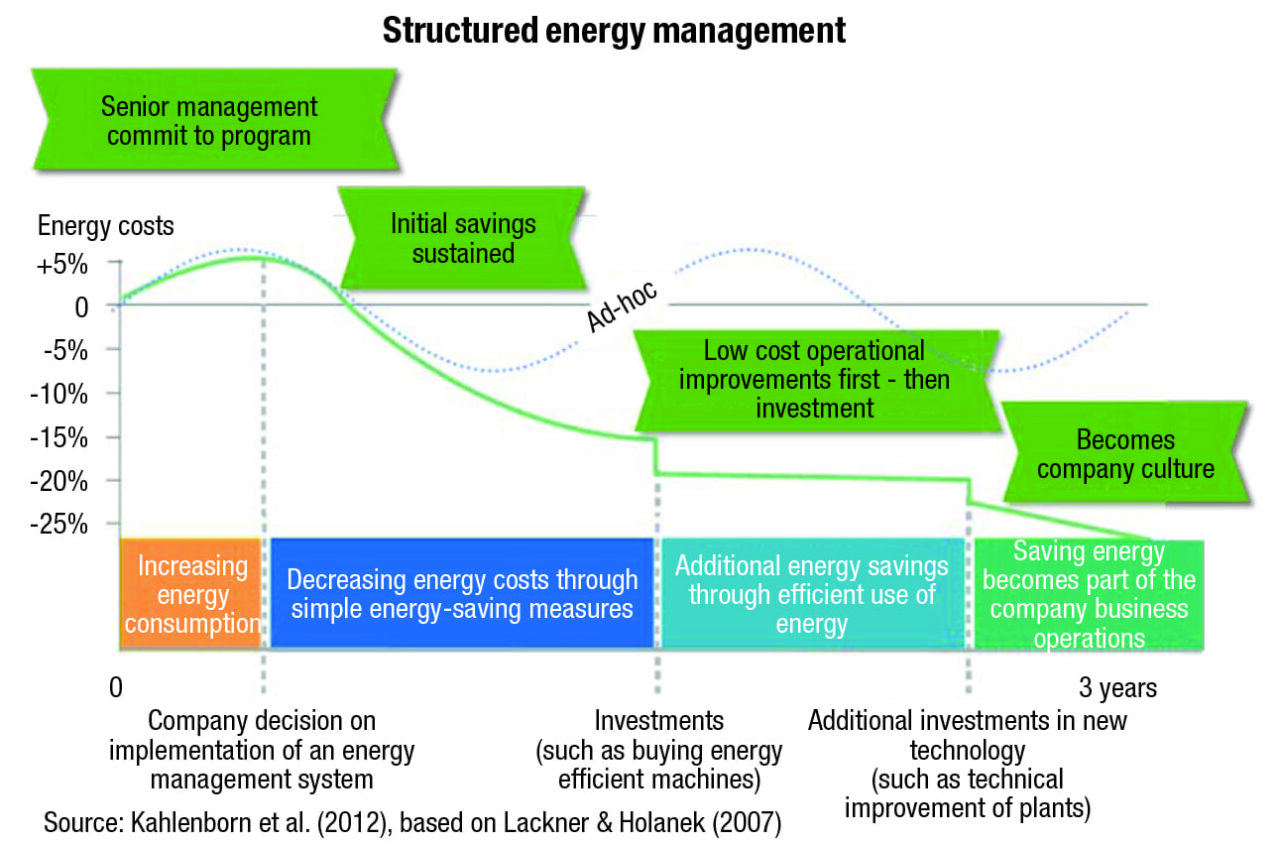
FIGURE 1. At many CPI sites, quick wins in energy savings may have already been carried out. Additional investment in new technology, such as self-service analytics, can continuously help to reduce your organization’s carbon footprint
Improved energy management
Global interest in Industry 4.0 [2] and IIOT has accelerated digital transformation in process manufacturing sectors, and specifically in the commodity and specialty chemicals industries. Many companies have engaged in technology pilots to explore options for reducing costs, increasing overall equipment effectiveness (OEE) or regulatory compliance. One of the best ways to leverage these new innovations is to apply advanced industrial analytics to production data generated by sensors. Every piece of data provides insight and unique opportunities for improving energy efficiency.
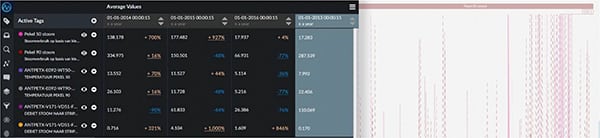
FIGURE 2. This figure shows energy consumption per production line for three consecutive years showing performance against the reference year. The right side of the figure shows sensor-generated, time-series data that provide a graphical representation of operational performance
Options to trim energy use
In general, energy savings can be achieved in various ways via the following efforts:
- Changes in daily behavior (such as switching off the lights)
- Installation of more energy-efficient equipment
- Improved equipment maintenance
- Ongoing process optimization
- Efforts to ensure operation of equipment systems within their best operating zones
Process optimization and the ability to optimize asset performance offers one of the biggest opportunities for energy savings, but such efforts require a deeper understanding of operational process data and asset-related data (such as data collected by the data historian) [3, 4].

FIGURE 3. Predictive maintenance can reduce the fouling of heat exchangers in a factory
Monitor and analyze key items
The major process and asset-related energy consumers include water, air, gas, electricity and steam (WAGES) systems, and the performance of each of these processes can be directly or indirectly analyzed using sensor data. Too often, utilities and energy are neglected at the plant level, since there are more-pressing needs and analyzing inefficiencies in WAGES systems is laborious.
Specifically, looking for inefficiencies across the various WAGES systems is time-consuming because these critical plant utilities are used all across assets, plants and sites. For example, a plant could have hundreds of unit operations that require nitrogen or steam. For an individual to find the root cause of what may have created an increase in overall steam usage would require looking at possibly hundreds of tags from the data historian — and would essentially be akin to finding a needle in a haystack. It is rare for plant personnel to have the time available to dive deeply into an investigation like this. Most of the time, no one would even look at the steam flowmeter unless a major issue had arisen.
SMEs such as process, operations and maintenance engineers have deep knowledge of production processes. Such individuals are in the best position to understand the process behavior and assess root causes when using advanced analytics tools tailored for their daily tasks (called self-service advanced analytics), wihout the need to necessarily gather data manually, create a complex data model or validate the results.
Through a self-service analytics tool, the data can be descriptively analyzed to determine what has happened. And if a long period of performance can be assessed, the performance can be better understood. Sometimes, certain issues happen only a couple of times per year but can have a big impact on overall energy consumption (for instance, a trip that causes a shutdown). Discovery-analytics capabilities allow the SME to understand what has happened, and through diagnostic analytics, the organization can then start monitoring the performance of the site more effectively.
Since asset performance is contextualized by the process in which any given component is functioning, the best operating zones or performance windows need to be extracted from actual process behavior rather than theoretical data. Based on the historical data, best operating zones or best performance envelopes (also called the “golden fingerprints”) with regard to energy consumption can be created to monitor good and bad behavior. Additionally, monitoring live operational performance can be used for predictive analytics, for instance, to predict the impact on downstream performance of behavior an hour or more upstream.
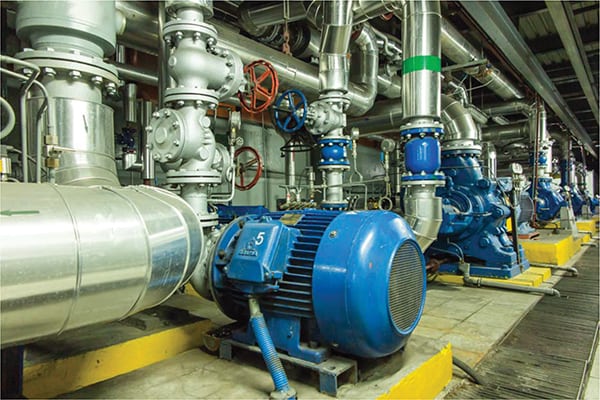
FIGURE 4. The cooling of industrial water-pumping equipment can be monitored using advanced analytics
Practical use cases
Using best-in-class, self-service analytics tools is easier and more efficient than creating data models from scratch. To stick with our previous example, for an SME to compare hundreds of tags to see what may have caused a spike in the unit’s battery-limit steam meter would be very time-consuming. By comparison, using an analytics tool, SMEs can quickly get answers to relevant questions such as:
- Is the air or demineralized-water usage in my steam or nitrogen plant abnormal?
- Is there anything that correlates with this abnormal usage right now?
- How can I quickly figure out why my WAGES are abnormal so I can take timely corrective action?
With traditional data-modeling tools, these questions could take weeks to answer, which is why they are often neglected. There are many instances where advanced self-service analytics tools have been successfully used to analyze, monitor and predict process and asset performance.
Case 1. Energy consumption within a cooling water network. A large number of reactors were consuming cooling capacity from the utility network for cooling water. Sufficient cooling capacity is critical for many of the reactors, because thermal runaway reactions could occur when the available capacity is insufficient. To avoid this hazardous situation, advanced analytics capabilities were established to monitor the cooling capacity in real time.
Early warning signals were created to alert for actual problematic situations, thereby minimizing false-positive alarms that could be triggered by measurement noise or spikes in the data. Once the process operator or engineer receives a warning, there is ample time to re-balance the reactors and de-prioritize other equipment so that the critical ones have access to the maximal cooling capacity. This helps overall energy consumption and process safety to remain within target boundaries.
Case 2. Energy consumption related to a burner oven. A burner oven was suffering from multiple trips, causing production losses and increased gas consumption. Through advanced process-data analytics, multiple previously unknown root causes were found to be responsible for the trips. With this increased understanding of the process, monitors were added to alert the key stakeholders. The monitors allow the SMEs to take appropriate action when a specific cause of a trip occurs, and thus avoid a trip from happening.
The events are now also automatically annotated with the explanation of the root cause. This way, the organization is actively learning to control the process based on combining actual process behavior with subject matter expertise. With downtime reduction achieved, gas consumption has also decreased significantly, but more importantly, the energy consumption is being improved continuously over time.
Case 3. Predictive maintenance to reduce fouling of heat exchangers. In a reactor with subsequent heating and cooling phases, the controlled cooling phase is the most time consuming. Fouling of heat exchangers increases the required cooling time. However, scheduling maintenance too early leads to unwarranted downtime, while scheduling it too late leads to degraded performance, increased energy consumption and potential safety risks. To enable timely maintenance, a cooling time monitor was set up, extending the asset availability, reducing the maintenance cost and safety risks. All of these benefits, including controlled energy consumption, ultimately led to 1% or more overall revenue increase of the production line.
Continuous improvement
In general, finding and solving root causes for process deviations and anomalies results in a more energy efficient operation. Monitoring the live production performance allows for better control of various production parameters, including energy consumption. When the total energy consumption of a specific year is taken as a baseline, the monitoring of performance against corporate goals becomes possible.
For example, Covestro AG, a leading manufacturer of polymeric materials for many CPI applications, initiated three major energy-savings projects for its polyether plant in Antwerp as a part of its energy-savings goals and ISO50001 directives. Self-service industrial analytics solutions were implemented for online detection, logging and explanation of unexpected energy consumption (providing both root-cause analysis and hypothesis generation), and for comparing the results with the reference year 2013. Using specific formulas and calculated tags, various energy-consuming operations are monitored and controlled. By monitoring the performance against the reference year, the company was able to see that energy consumption has been effectively decreased year over year, to meet its corporate goals. More importantly, with a growing knowledge and insight into the process, Covestro is continuously improving its overall performance.
Closing thoughts
Energy management is not new; many companies have a structured energy-management program in place. However, new self-service analytics tools now allow SMEs to analyze, monitor and predict process and asset performance, which can help them to meet company-wide carbon footprint goals. And when the so-called low-hanging fruit for energy savings has been picked and more knowledge is applied to improve operational performance, SMEs get the added benefit of improving overall profitability and increased safety. n
References
- https://www.basf.com/en/company/sustainability/environment/energy-and-climate-protection/energy-efficiency.html
- https://www.mckinsey.com/business-functions/operations/our-insights/manufacturings-next-act
- http://www.nexant.com/resources/fundamentals-strategic-energy-management
- https://www.trendminer.com/resources/videos/covestro-leverages-process-data-analytics/#form-anchor
Author
 Edwin van Dijk is a vice president of marketing for TrendMiner N.V. (5444 Westheimer Rd., Suite 1082, Houston, TX 77056; Email: [email protected]; Website: www.trendminer.com). He has more than 20 years of experience in the process and power industries. After more than 10 years at Greenock, selling plant-design software to owner-operators and contractors, he started at BlueCielo ECM Solutions. In his role as business development manager for the integration between IBM Maximo and BlueCielo Meridian, van Dijk brought the solution to market with the slogan “Maintenance and Engineering Connected.” Through various roles within BlueCielo, he has been an integral part of BlueCielo’s evolution to expand this solution into today’s corporate market positioning. Within TrendMiner, he is responsible for the global marketing strategy, which includes a focus on educating the market on the benefits of using advanced data analytics in various CPI applications.