Producing a perfect batch is easy for some products but harder for others. Using analytics to dig into production data can help operators identify where variability might be creeping into a process
For many batch manufacturers in the chemical process industries (CPI), creating a “perfect” batch — one for which everything works just right and all quality specifications are met — is a key objective. While a batch is being produced, all the conditions associated with it should be recorded as a matter of course and, ideally, those conditions should be repeated every time.
Going back and looking at earlier efforts (as captured by a data historian) can provide additional insight. Identifying which batches turned out perfect and reviewing the production data associated with those production runs is a great way to create critical process parameter (CPP) profiles (with acceptable tolerances). These can then serve as guides to create perfect batches every time.
Conceptually, this approach makes sense, and many manufacturers find it a useful way to control and maintain production. It may work most of the time with most products. But implementing this concept when working with more troublesome products and processes can be very difficult, particularly during the production of certain complex chemicals and pharmaceuticals.
Try as they might to control all the CPPs of a recipe to positively impact product quality (as measured by a group of critical quality attributes or CQAs), manufacturers still create batches that are out of specification (or “off-spec”). In many cases, it often becomes clear that the number of variables, and the cause-and-effect relationships connecting CPPs and CQAs for a given product, are more complex than realized. Some variables might prove to be more important than initially thought, while others will not matter as much. Other variables will prove to be capable of affecting the outcome, but might not be covered adequately by the existing instrumentation or even recognized.
Consistent batch-after-batch success requires first acquiring and storing the necessary data about the product — with the required level of detail — and then analyzing the data carefully to yield actionable insights.
Working in the real world
Consider a hypothetical example. Picture a typical process unit, such as a reactor. It is a jacketed, stainless steel tank — so it can be heated, cooled and pressurized as needed. It has an agitator, inlet pipes, outlet pipes, pressure instruments, temperature sensors and pH sensors. Various batch recipes call for it to be used when making a few dozen different products, with production times ranging from a few hours to a week, per batch.
While performing a unit procedure for a given product, there will normally be at least 15, and perhaps 20, process variables instrumented and recorded by the data historian. To make the example more specific, Product A is made in this reactor at least 25 times per year, so roughly once every two weeks. A run of Product A takes about 16 hours from start to finish, plus additional time for equipment setup and cleanup.
In the data historian, there are batch records dating back more than two years, covering 60 batches of Product A produced in this reactor. Perhaps two batches each year fail to meet specifications and are discarded. Running a replacement batch delays the schedule by at least two shifts.
The recipe for Product A has five main steps where ingredients are added, and then the reactor is heated and cooled. Process experts have identified six CPPs that need to be controlled within specified limits during the unit procedure for a batch to meet specifications. The process is generally stable and controllable enough to run within the lines most of the time.
Nonetheless, some batches fail to meet the specifications, even while apparently keeping CPPs “in spec.” This is vexing since running within the limits on all six CPPs is supposed to produce an acceptable batch. Those limits reflect what the company’s process engineers believe are the required attributes observed in the best batches, but sometimes they still don’t produce the desired result.
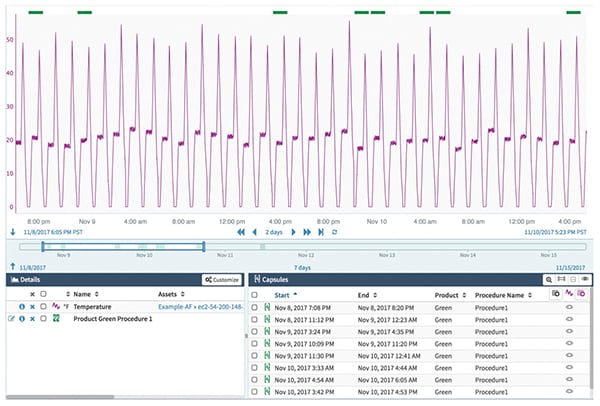
FIGURE 1. Historians typically record operating data continuously, so the data for a given product and batch have to be identified. The green bars shown at the top identify the relevant data segments for the CPP being analyzed for the specific product
A more methodical approach
To solve the puzzle, an enterprising process engineer may gather up data from the reactor’s control system and data historian (Figure 1). Loading it into Microsoft Excel or similar software is a tedious but manageable task to extract data and create graphs (Figures 2 and 3), and to compare specific attributes tied to CPPs across multiple identical unit procedures.
Batch by batch, it is possible to examine the solution temperature, the agitator speed or other factors that might be suspected of causing a problem. This approach sometimes works, and it might even generate some possible answers, but it will probably be necessary to dig deeper. The practical limits of manual analysis with Excel for complex processes will soon be encountered.
The next level is a more sophisticated data-analytics approach. This may be a function built into a data historian, or more typically, a third-party application designed to work with data from the historian. These applications make analysis easier by extending number-crunching capabilities beyond a normal spreadsheet, combined with mechanisms to aggregate data.
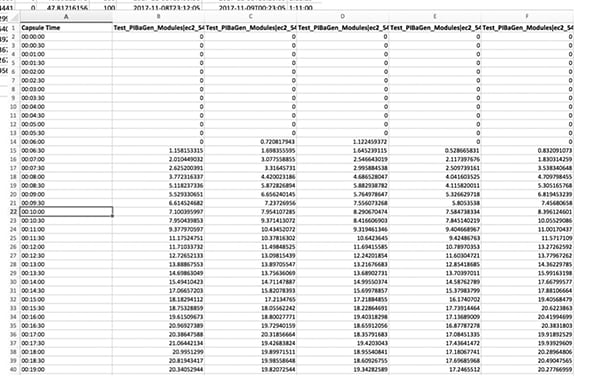
FIGURE 2. Importing the data into a platform such as Excel provides the means to extract the relevant CPPs, but the process is tedious
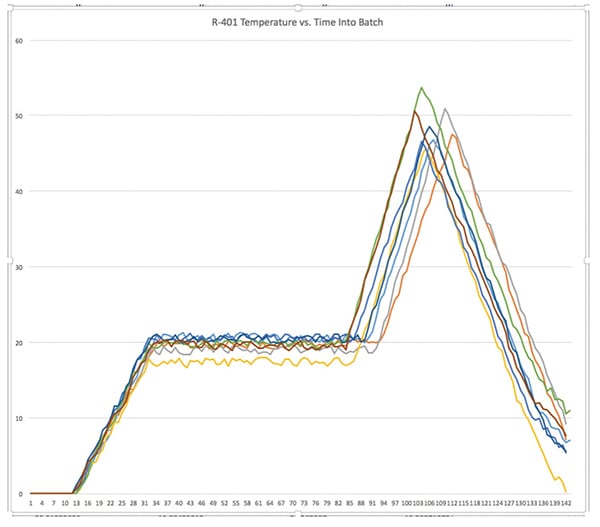
FIGURE 3. With some effort, a spreadsheet can help generate graphs of the specific CPPs so they can be compared directly against each other
Ongoing technology advances
Ongoing advances in analytics software have greatly simplified the infrastructure required to implement data-analytic applications. Cumbersome techniques, such as spreadsheets, data cubes and data warehouses, are no longer needed. Modern data-analytic platforms can run on typical office computers, communicating directly with the historian and extracting data as needed for any computations.
Returning to the example discussed above, process engineers watch six CPPs connected to unit Procedure A. Using data recorded in the historian from the 60+ unit procedures (Figure 4) that generated good batches with acceptable specifications on all CQAs, it is a simple matter to graph the six variables for all the unit procedures. Curves for each CPP from all 60 unit procedures can be superimposed on each other using identical scales.
Using this approach, it is easy to see whether the curves tend to form a tight group, or if they spread out, showing different values at various times for a given CPP (Figure 5). The data-analytics platform can aggregate all these curves into an ideal profile for that CPP. This then becomes the reference profile for that CPP, for that product manufactured, using that equipment. This is necessarily specific, given the importance of only comparing “like data.”
Using the reference profile, it is possible to generate upper and lower tolerance limits — or boundaries — based on an appropriate value, such as two or three standard deviations (Figure 6). Exactly where these boundaries need to be set will ultimately be determined by the process and how variability of this CPP affects the final product, but using this approach is a good place to start. There is no advantage in making every tolerance profile equally tight. Allowing wide tolerances for variables that still support CQA requirements will ultimately create a process that is easier to control.
This same procedure can be repeated for every CPP to create a reference profile and a set of boundaries for each of those variables. Data for a CPP can even be aggregated into a single value, which can become a useful metric for comparing many batches. Histograms of these metrics provide a quick view of process variability.
When the process is thus characterized — using data from on-spec and high-yielding batches — it is possible to gain insights by looking at various excursions from known good values and resulting off-spec batches (Figure 7). Once there are reference profiles for every CPP, it is easier to tell where things might be going wrong. Instructions can be written to look for specific conditions.
One example would be a set of instructions to find every batch where the temperature change at the beginning of the crystallization phase ran from the high to the low extreme. With the right data-analytics application, these types of queries can be constructed without creating complex formulas or macros.
Such analysis can also identify those parameters that are controlled too tightly. For instance, temperature does not have to be controlled with the same level of precision at every phase of a unit procedure. In fact, the tolerance range boundaries at one point can be increased, while at another they need to be tightened. Matching the boundaries more appropriately to the actual needs of the process reduces costs while improving batch-acceptance rates.
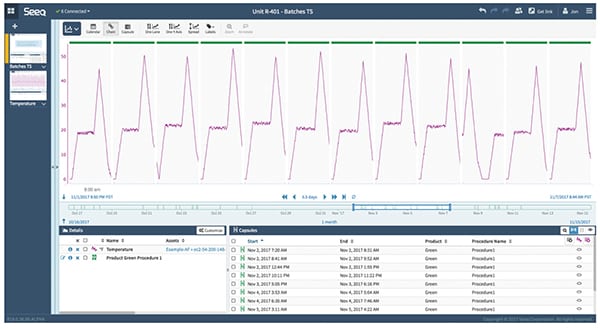
FIGURE 4. A sophisticated analytical platform (compared to just the use of a simple Excel spreadsheet) can help users capture the CPPs easily, pulling them out of the historian automatically
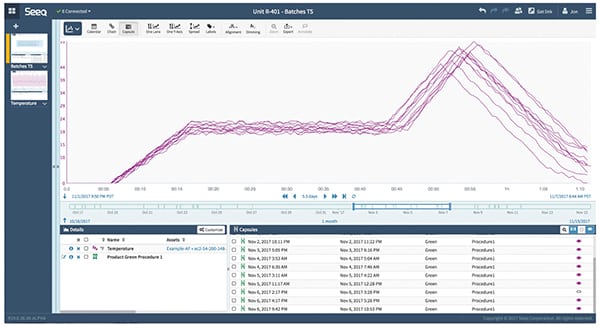
FIGURE 5. The data analytics platform can easily create superimposed graphs using automatic ranging and scaling capabilities. This allows process engineers to quickly recognize which curves tend to form a tight group, and the platform can aggregate all of these curves into an ideal profile for that CPP. This becomes the reference profile for that CPP for that product manufactured using that equipment
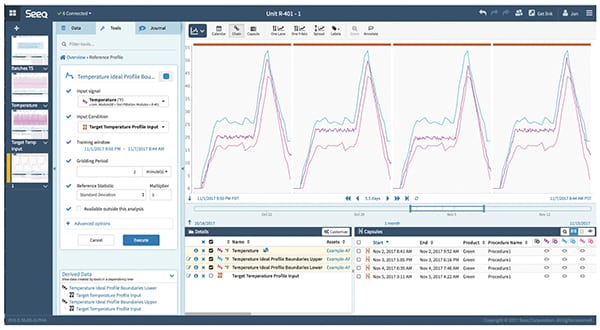
FIGURE 6. Using new-found insight, the most successful, consistent batches can be examined in depth. Using the reference profile, it is possible to generate upper and lower tolerance limits based on an appropriate value, such as two or three standard deviations
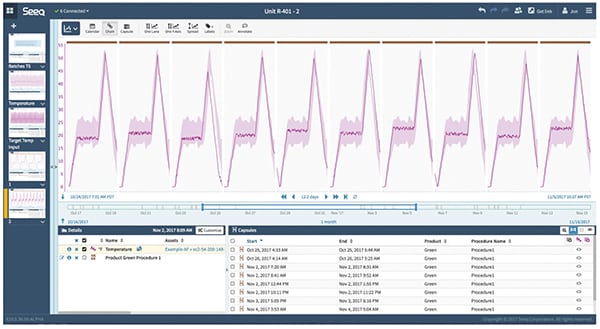
FIGURE 7. Once the limit bands are established — using data from on-specification and high-yielding batches — it becomes a simple matter to compare any batch, successful or not, to those limits and to gain insights by looking at various excursions from known good values and resulting off-spec batches
Applying the tools
This kind of analysis cannot solve everything by itself. It can work with the data available, but it cannot create meaningful insight without sufficient information. As mentioned at the beginning of this discussion, manufacturers do not always measure everything they should. The temperature at a specific point in the reactor might be a very important CPP, but unless there is a temperature sensor capturing readings at that point, there will be no data.
Similarly, such analysis cannot suggest hypotheses, nor can it draw conclusions, but with these tools in hand, the engineers carrying out the analysis can begin to consider what-if scenarios. This is where the human element becomes important. Process experts can advance theories of what might be happening, and then use the data-analytics tools to see if experience supports a given cause-and-effect relationship. The advantage of today’s tools is the relative ease with which such theories can be tested.
Extending our example, let’s say Product A is a crystalline substance that must be precipitated from a solution, beginning 14 hours into the unit procedure. The crystallization process tends to vary from batch to batch, which affects yield, but no one has been able to identify exactly what is happening during the process to account for this variability. Engineers looking at the situation have different theories:
- Jim argues that it relates to the temperature at the start of the crystallization phase — he says it should be higher
- Anne thinks the rate of temperature change is key, and the cooling action should be faster
- Chris sees it as a concentration problem caused by an incomplete reaction at an earlier stage
Each of these suggested remedies can be evaluated by performing basic extractions from the larger block of historian data, and by then performing various data analytics.
For Jim, it is possible to look for specific solution temperature values at the critical point in the process. Here are the situations where we were bumping against the upper limit against those where we’re at the bottom. How do those compare with overall yield? Is it a clear and direct relationship? Does it suggest there is still another factor influencing the outcome?
For Anne, the slope of the temperature line is critical, and it is easy to separate the steep from the slow. Beginning solution temperature can also be factored in, along with the cooling water temperature and flow. If we can cool more quickly, does it really affect yield?
Maybe Chris is right and we aren’t watching the earlier reaction closely enough. What about concentration at the beginning of the crystallization phase? Does it have a significant enough effect on yield to re-examine how it works?
Testing these theories and even hunches against the data requires the ability to look at aggregate effects, with the option of drilling down into the details when necessary. Comparisons must be easy to make, even when multiple factors are involved. Our group of engineers may begin by looking at the unit procedures with the highest yields, and then back into the other variables. Or the approach might be to test each theory individually or in combination. The software should be able to perform regressions and other analytics to show where correlations exist and where they do not.
Jim, Anne and Chris may all be right — the crystallization process needs to start at a higher temperature, but be brought down as quickly as possible. The upstream process may also need to be tweaked. Once the unit procedures where those attributes can be identified have been examined, it’s a simple matter to make the necessary adjustments to the process. The fix is easy; it’s finding the problem that’s hard, unless the right tools are used.
To make this practical, all the raw data must be accessible by the data-analytics tool, and the mechanisms to do the extractions and comparisons must be easy to implement. Data-analytics tools have come a long way in this respect, by offering more intuitive interfaces using drag-and-drop capabilities, rather than requiring users to write equations and macros. It is now easier than ever to find the areas of interest in the data, and to perform the kinds of analysis necessary to test theories.
The human element is critical
Naturally there are limitations. Even the best analytical tools are no better than the quality and consistency of the data being analyzed. The kind of analysis discussed so far works great with clean data. But that often is not available. Real-world process data have gaps, process values flatline at times, process instruments can go out of calibration or a given variable might be missing entirely for a unit process. Analytical tools need to help engineers work with the data as it is, providing mechanisms to account for and work around these issues.
Consistency is essential. In our example where we are looking at 60 unit procedures, all the variables must have been measured and recorded in the same way in every case. If the solution temperature sensor was moved from one part of the reactor to another before Batch 28, it might affect the measurements, thereby reducing the confidence in any conclusions built on that attribute. These things happen, and analytical tools should not be stymied when small obstacles are encountered.
And most importantly, process engineers and experts are needed to advance theories and interpret conclusions. Automated analysis can find correlations, but will seldom identify cause-and-effect, particularly for complex processes. The solution is to pick the right data-analytics tool and put it in the hands of those with a deep understanding of the process.
Author
 Jon Peterson is co-founder of Seeq and serves as its senior vice president of Product & Customers (1301 2nd Ave, Seattle, WA 98101; Phone: (206) 801-9339). He began his career as a process engineer and software developer for process industries, spending 21 years at software developer OSIsoft (then called Oil Systems, Inc.), where he held leadership roles as vice president of Engineering and vice president of Marketing, working in a wide range of areas, including asset optimization, energy management, advanced control and process equipment design. While at OSIsoft, he was instrumental in the architecture, design and coding of the PI Server. The PI Server 3.0 is recognized as the industry standard and has nearly 15,000 installations worldwide. Peterson holds a B.S.Ch.E. from Northwestern University.