A real-life example is provided to show how to stay on program and within budget
Over the past few years, much has been written in the trade press about how to manage large, $1- billion-plus plant-construction and expansion projects in the chemical process industries (CPI). However, when it comes to managing projects with a smaller scope — say, projects in the $25–250 million range — a variety of nuanced management issues arise. Such projects include small new plants, additions to existing plants, and expansions of currently operating facilities. This article suggests practical and immediate ways to deal with some of the unique management challenges that often arise.
Large mega-projects are usually managed by one of the larger, world-renowned contractor firms, which have a full suite of project-management tools, capabilities and expertise at their disposal. Such contractors have built larger-than-life projects, using tried-and-true project-management protocols that have been successfully used on hundreds of projects over many decades around the world. Although problems do occur, they are more often related to misunderstandings than surprises, and the contractor usually has the deep expertise needed to address any of these problems as they arise.
However, smaller, more frequently incurred projects, such as plant expansions or conversions, are often managed by smaller, less-experienced contractors, who do not always have expertise or experience with the sophisticated project-management processes that are used by the mega-contractors. As a result, such projects often run way over budget, defy timeline constraints, present numerous surprises, and even lead to lawsuits.
One reason is that the CPI plant personnel who are frequently tasked with the responsibility of overseeing such projects are not, by training, project managers. Rather, their expertise lies in running the plant on a day-to-day basis — ensuring that raw materials are available, that existing equipment is ready for production, and that trained personnel are available to make the product. Their expertise does not lie in the realm of managing engineering manhours for plant design, or in procuring and expediting the delivery and deployment of large tanks, reactor vessels, pumps, motors and more. And the experience and expertise required to determine if the construction portion of the project is progressing as promised and as needed to meet budget, schedule, quality and safety norms is typically beyond the skill set of most plant personnel — they are simply not experts at managing a team of contractors.
Nonetheless, many CPI organizations still try to manage the contractors who are building their small or medium-sized new plant or expansion projects by using only their existing plant personnel. Sometimes they derive comfort from assurances from their contractors, who say “nothing will go wrong.”
Often this is due to a reluctance to spend extra money on third-party overseers. Sometimes it is due to a perception that since project building and construction management are not based on finely tuned formulas and recipes, these activities can simply be overseen by existing plant personnel, adding just a few hours per week of extra duties to an already full-time schedule.
Unfortunately, as is often the case, the result of such an approach is a scenario characterized by budget overruns, schedule delays, and at times, lawsuits.
A real-life example
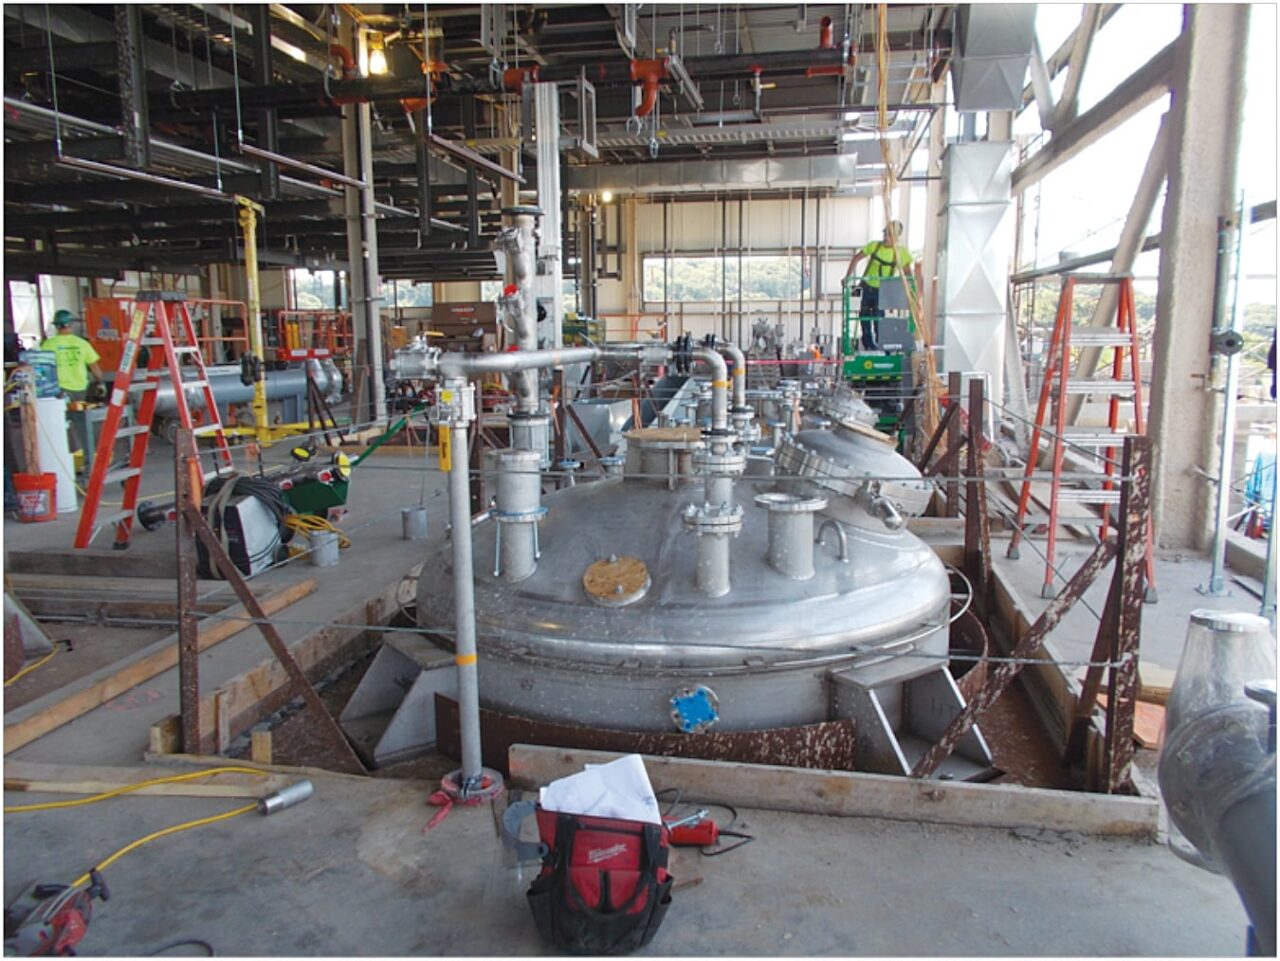
Figure 1. Can the owner of this chemical plant expansion be assured that this relatively small project will be completed on time and within budget? Yes, and with relative ease, if the team follows the recommendations proposed here
Discussed below is a real-life example of what can happen “when the meager are challenged by the eager.” At one CPI facility (Figure 1), a plant expansion was undertaken, involving the construction of a new facility to replace an existing one, with the goal of more than doubling the number of products from 80 to 170. The project was planned to be performed with no downtime — so the existing facility continued to produce the initial 80 products throughout this initiative.
Now envision this new facility designed for 14 newly added production vessels and reactors, each requiring its own pumps, motors and valves, and tapping into shared service systems. Imagine more than two dozen extra-large holding tanks, indoors and outdoors, each with its own set of pipes, pumps, motors and valves, all feeding into the 14 production vessels and reactors.
Add to this the need to build a structure to house all of this — just one aspect of the project that required more than 2,500 cubic yards of concrete (enough to build a ten-mile long sidewalk), and more than 600 tons of structural building and support steel. The five miles of stainless steel piping connecting all of these tanks, vessels, and reactors required 15,000 individual butt welds. Also required were power cables — more than 13 miles of them — and nearly 30 miles of instrumentation cables to connect more than 1,500 instruments. Although this project involved only one main contractor, there were 50 subcontractors involved, and each required coordination and support, in a planned period of 14 months.
How does the plant manager, or his or her designee, know when trouble might be just around the corner? Usually, the main contractor promises that nothing major will go wrong, but in the event that there are signs of impending problems, the contractor promises that the management tools and protocols being used will highlight them in plenty of time to allow corrective action to be taken. This was the case in the above-described project.
When reality sets in
At some point, reality does set in, as it did in the case discussed here. One day the plant manager decided his staff was too short-handed to really know where the project stood. There were more than 100 craftsmen on the job, large vessels, tanks and reactors were arriving on a regular basis, pipe prefabrication had begun at an off-site facility, and safety issues were cropping up. The plant staff just could not stay on top of it all. So a third-party overseer was engaged.
That engagement resulted in a series of project reviews and subsequent discussions. The first item that was discussed was the current project status — that is, what was the contractor’s perception in terms of the percent of the work complete at that time? At that point, the contractor was reporting that the project was 46% complete.
The first question from the third-party consultant was: “So that means there’s only 54% more to go, and then you’re done?” The answer was not a resounding yes. The next question sought to learn how the 46% assessment was derived. As it turned out, that estimate had nothing to do with the work effort actually being expended — the primary measurement needed to predict when a capital project will be done, and at what cost.
Therefore the discussions turned to how to better recalibrate progress measurement. The contractor was encouraged to look at the remaining work and decide how it should be scheduled going forward — by individual disciplines (such as civil works, steel erection and piping), or by entire systems (such as reactor vessel systems 1, 2, 3 and so on)? Because if the project really was 46% complete, the work measurement and focus should have been on reactor vessel systems instead of disciplines for quite some time. Everyone agreed on this.
To improve the progress-measurement process, the contractor restructured the schedule to reflect the work that remained in order to complete the original 14 production vessels and reactors and their support equipment. This now allowed the plant manager and staff to visualize where progress was actually occurring, and where it was not.
At the time the contractor professed 46% progress, almost none of the 14 vessels or reactors had yet been placed in the building. Almost no connecting piping had been received onsite. And a check of the warehouse receiving area showed almost no valves, instruments and other sundry items on hand and ready for installation. It was clear that the “46% complete” number was not a realistic reflection of the situation at that time. So then the open question was, what should it have been?
Measuring progress
Since the project would ultimately have more than 5 miles of piping, the contractor suggested the project’s progress could be measured in terms of feet of piping installed. This logic was agreed upon, because everything in the plant (outside of electrical work) was ultimately dependent on the piping in one way or another. For example, the steel was needed not only to frame the building in which the piping would reside, but also to support the piping as it was being hung. The piping then would connect all of the 14 production systems, their vessels, tanks, reactors, pumps and motors. Even installation of most of the valves and instruments (not yet onsite) would ultimately be dependent upon the piping. Ditto for the insulation. Therefore tying the project progress to the amount of piping installation completed made sense.
However, that was not the end of the story. The contractor’s suggestion that using the number of feet of piping installed as a proxy for the project’s progress had an obvious flaw. Since progress measurement, which is tied to schedule and cost, is really about work effort, the manhours required to put piping in place had to be considered. For example, how much effort does it take to raise into place a two-foot section of pipe versus a four-foot section? Essentially the same, except that the four-foot piece could claim twice the progress of the two-foot piece.
So a slightly different measurement was required, and that measurement was the number of pipe connections, in this case welds. Regardless of the length of the pipe, only the number of completed welds truly reflects the real progress of the piping work; hence this measure serves as an even better proxy for the progress of the overall capital project.
Therefore, a system of weld counts was developed. This approach, universally used in the construction of large power plants, was easily applied to this project. Since almost all of the welds were of the same size and wall thickness, a straightforward count of welds sufficed, as opposed to the concept of determining equivalent welds.
The system was simple. Using the design documents, most of the 15,000 welds were assigned to each of the 14 systems and the remainder were attributed to a category called “common.” In this manner, as welds were completed, one could now not only determine the project’s overall percent complete, but also determine the approximate state of readiness of each of the 14 systems.
For example, let’s say that each system had approximately 1,000 welds associated with it. That then left 1,000 welds to be assigned to the common category. So the agreement was that only once 7,500 welds were complete could the project work be called 50% complete, and this was not yet the case.
When the consultant was engaged, a detailed weld count revealed that only 3,000 of the 15,000 welds had been completed — leaving 12,000 welds still to be completed. Figure 2 shows the plan for those remaining 12,000 welds over the next nine months, and the actual progress to the mid-point of the job.
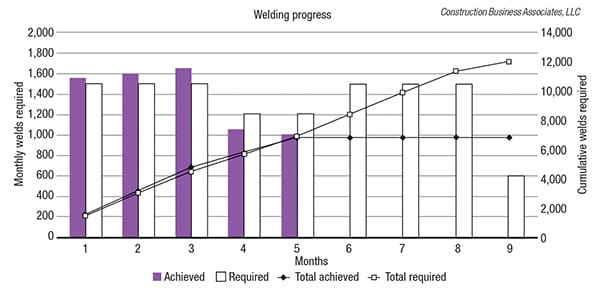
Figure 2. Shown here is a snapshot of the remaining 12,000 welds required to complete the project, and the actual pace of completion
As shown in Figure 2, 50% of the total 15,000 welds were completed in the fifth month of welding. Per the earlier agreement, that then equated to a project completion of 50%.
However, once a construction project, such as this chemical plant expansion, reaches that 50% completion stage, the focus needs to shift to include commissioning and startup. In this case, it was comforting to finally know that after 5 months of welding, approximately half of the work effort was complete — but this did not assure that all 14 systems would be ready for commissioning and startup, as needed, for the upcoming production cycle. So, attention was shifted to determine which of the 14 systems needed to be ready when. The systems were prioritized, and this effort helped to determine exactly which welds had to be made next.
One could now take the position that, having established a rational approach for measuring progress and establishing priorities, the work was well in hand and minimal attention needed to be paid to the remaining efforts of the contractor. Unfortunately, such a position is never prudent, and letting go of the management details could still end up with the project in a state of disaster. For this real-life project, this was fortunately recognized by all parties.
Build transparency
The key to building transparency in a complex expansion or revamp project is to know:
- When to switch from measuring by discipline to measuring by system
- How to determine progress as it relates to work effort
- How to measure progress as it relates to productivity
- How to measure progress as it relates to budget
- How to determine overall project completion
Costs
The question to be asked at this stage of the project was whether or not the contractor could meet the resource requirements to get from the current 50% to 100% within the allotted budget, in accordance with the restructured schedule. To answer this question, an additional view of the project was required — beyond just measuring the percent completed. The added insight required that the percent complete needed to be measured and plotted against time, so that the project could progress going forward. Figure 3 provides an example of this.
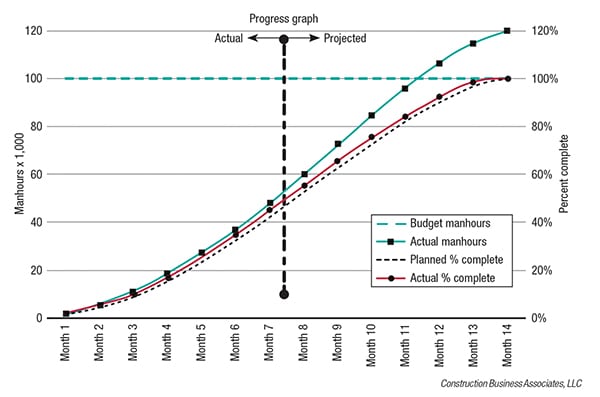
Figure 3. This progress graph projects that if no changes are made, the project will still be completed on time, but almost 20% over budget
As shown in Figure 3, plotting manhours (on the left vertical axis), and percent complete (on the right vertical axis) against time on the horizontal axis, both against a planned percent-complete curve (shown with a black dashed line), tells an interesting story. It shows that after 7 months, the 14-month project is essentially at the 50% point, just as was planned. However, it also shows that the costs are exceeding the budget, and actually have been since the work was initiated. If this were allowed to continue without a change in course, it would have resulted in a 20% overrun (or greater) of the budget.
In most scenarios, this is not acceptable. So the project team needed to review the plans that were in place for completing the second half of this project.The goal was to see if there might be alternate approaches that would still maintain the schedule while also maintaining or reducing the costs and resources required. Usually, at this stage of the project, there are still some opportunities to change the trajectory of the budget projections and timelines. In this particular project, with half of the welding still to be completed, changing from manual to orbital welding provided an ideal opportunity to reduce future costs (by reducing the number of hours required to complete this work).
The outcome
Ultimately, this project was completed on time and within budget. However, it is doubtful that outcome would have been the result without the intervention of someone attuned to the intricacies of project management, someone who understood the complexities of linking the worlds of engineering and equipment procurement with the world of construction (classically called EPC management). The intervention started with a shift to manage the project not by physical disciplines, such as civil, steel and mechanical erection (the traditional approach), but by production systems (discussed earlier). This allowed everyone’s focus to be realigned to concentrate on, and prepare for, the systems’ readiness.
The next step was to develop a system of progress measurement that reflected actual work effort expended versus the effort that was still required. In other words, if a project is 46% complete, does that truly translate into only 54% more work effort manhours required to complete the project? The challenge here is to pick a measurement that is readily understood, yet representative of both the actual work performed and the remaining work still to be performed. In this case, settling on the measurement of the number of piping welds completed was key.
The third step was to marry the progress measurement and percent-complete with the work effort expended. In reality, the goal was to determine the work effort still required to get to completion (that is, how many manhours have been used versus how many more are required to complete the work). Comparing these two metrics (percent complete and manhours still to be expended) against a timeline provides insight into whether the project will be completed on time and within budget. In this case, the answer was no, unless other, less costly or more-efficient ways were found to complete the remainder of the work. This challenge was addressed by switching to orbital welding.
The rest of the story
The prior discussion concentrated on the mechanical work required to complete this project. Similar approaches were taken with the electrical work and the instrumentation wiring. These disciplines, within each of the 14 systems, were also measured and compared to percent complete against time.
For the electrical work, wiring terminations were used in a similar manner as weld counts (as a reasonable proxy for work completed). The mechanical work then was prorated with the electrical and instrumentation (E&I) work to derive a total percent of the project completed. For this project, the mechanical work was assigned a value of 65% (based on total manhour requirements). The E&I work was collectively assigned a 35% value. So when half of the mechanical work was complete (50%), and the 20% of the E&I work was complete, the overall project was 40% complete, calculated as follows:
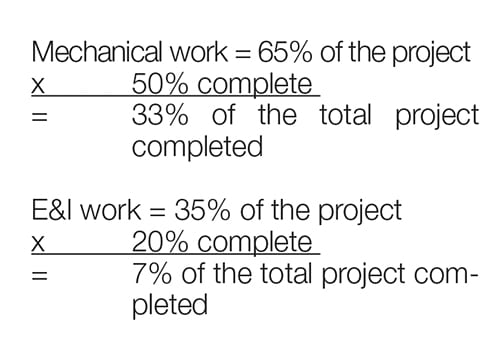
Adding these two numbers (33% plus 7%) demonstrates that 40% of the total work had been completed. This measurement process continued until the project reached completion (100%).
The takeaway
In summary, when faced with an EPC plant build-out or expansion project that does not involve a large, dedicated industrial plant construction contractor, thought should be given to what could go wrong. Does the plant staff have the project management experience to ensure total transparency between the contractor and the plant? Even if it does, will the plant management staff have the time required to ensure this? Is there someone available who can provide the proverbial “sniff test” that all aspects are on track? In other words, is someone available on staff to drill down into the details of the project to ensure this transparency?
If the answer to all of these questions is a definite yes, then no more is required. However, if it is not an unqualified yes, then the project would benefit from a third-party partner to provide support and oversight.
Edited by Suzanne Shelley
Author
 Peter Hessler is the president of Construction Business Associates, LLC (2310 Seven Lakes South, West End, NC 27376; 910-400-3113; Email: pghessler@constrbiz.com), a provider of business-management services to the power and process construction industries. He has almost 40 years of experience in the power and industrial plant construction and maintenance industry, worldwide, having worked as an owner, contractor, and now as a consultant. He has a B.S. in Mechanical Engineering from Virginia Polytechnic Institute, and is the author of two books on the subject of power-plant construction management. He also has published numerous articles on various aspects of managing large industrial projects.