Note: This story is also available in a complimentary, full-screen version https://www.chemengonline.com/eh-modern-instrumentation-simplifies-maintenance/
Built-in diagnostics and condition monitoring improve maintenance, process reliability and plant availability
Today’s modern world is steadily digitizing all our daily routines, but the majority of the chemical and petroleum-refining industries remains far behind current technology. The maintenance process is especially lagging due to old operating systems, lack of exposure to new technology and conventional mindsets regarding maintenance of instrumentation.
A typical maintenance strategy in a chemical plant involves performing planned routine maintenance and only being reactive once equipment fails to the point of introducing reliability or safety concerns. Then the maintenance crew rushes to replace the device if it’s available as a spare or expedites shipment from the manufacturer. Meanwhile, the process is shut down.
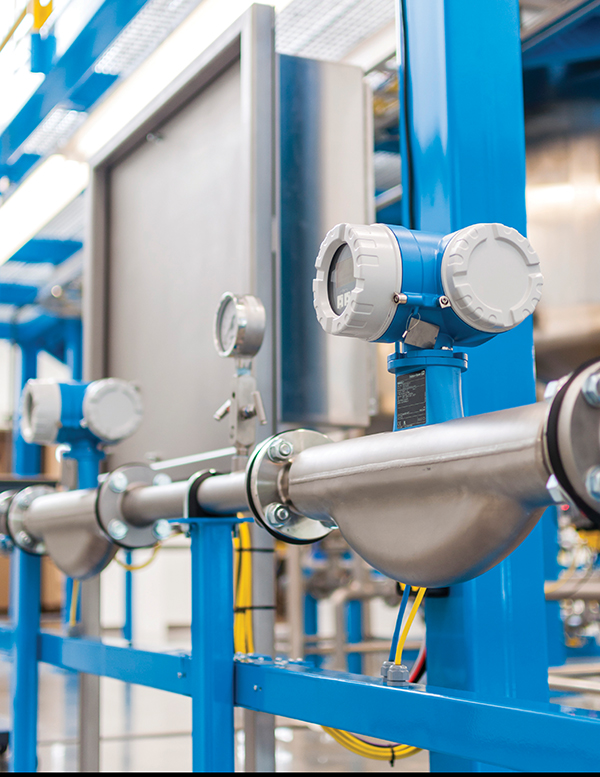
FIGURE 1. Modern instruments, such as this Coriolis flow
meter, have built-in diagnostics and condition monitoring
Even though instrumentation nowadays is getting “smarter,” with functions such as self-diagnostics and condition monitoring (Figure 1), most plants don’t take advantage of it. Unfortunately, 97% of the smart instrument data are not being used.
This article discusses how modern instrumentation and supporting software can replace the conventional planned and reactive maintenance strategies that consume too much time and cost too much money in terms of labor and unnecessary calibrations. Modern instrumentation also greatly improves reliability and availability of the facility by diagnosing and predicting device failures before a process must be shut down.
With diagnostic information readily available, maintenance personnel know the exact health conditions of all devices. This enables them to perform the right maintenance at the optimal time, avoiding over-maintaining equipment that doesn’t need it.
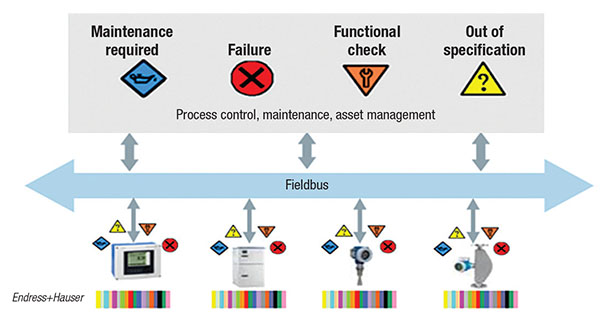
FIGURE 2. Almost every instrument
manufactured today
provides NAMUR 107 data
Smart instruments
NAMUR NE 107 (Figure 2) is a standard that every instrument manufacturer follows when devices are being designed and manufactured. It provides diagnostic codes with clear messages and remedies, including maintenance required, function check, out of specification and failure. With this information, the maintenance crews obtain clear direction on how to troubleshoot and fix the issue before the device deteriorates to complete failure.
A green diagnostic code indicates a healthy instrument. Orange means the instrument is undergoing a functional check, so the signal is invalid. Blue signifies that the instrument signal is valid, but maintenance is required soon. Yellow identifies that conditions may have caused an out-of-specification situation and therefore an uncertain signal. Finally, red represents a failed instrument providing an invalid signal and requiring immediate maintenance.
The NAMUR 107 data are sent over fieldbus, EtherNet/IP, 4–20 mA HART, Wireless HART or other connection methods as an alarm message (when conditions apply) or when interrogated by a control system.
Modern instruments can easily provide these data because almost all instruments from major vendors employ self-diagnostics. Self-diagnostics means that the instrument is capable of detecting when it has a problem by continuous monitoring of relevant internal parameters related to its mechanical, electromechanical and electronic components.
Typically, during the instrument’s design phase, a failure-mode-effects and diagnostic analysis is performed to identify critical components in the signal chain, starting at the process-wetted parts and followed by the electro-mechanical components, amplifier board, main electronic module and outputs. A proper margin of safety is then assigned to every critical path or component.
Firmware in the transmitter continuously monitors the entire signal chain for deviations. For example, if the diagnostics detect an error, it sends an event message conforming to NAMUR 107. The event is displayed on the instrument’s front panel and is available to the automation system. Some instruments also send troubleshooting tips and remedial instructions.
Calibration and verification
Depending on the industry, instruments must be calibrated periodically. For example, the chemical industry has requirements for proof testing per IEC 61508 and IEC 61511.
Under old maintenance practices, where calibration is scheduled every six months or so, processes are shut down while the flowmeter or pressure transmitter is bypassed or removed from the line, possibly taken to a laboratory, calibrated, and then either re-installed or put into spares.
In some cases, instruments are found to be far out of calibration, and have been giving erroneous readings. The problem is, how long has it been out of calibration and how many out-of-specification products were produced? The plant has no way of knowing.
On the other hand, many instruments are found to be perfectly calibrated, so the entire calibration process was a waste of time and money. Self-verification avoids this unproductive effort.
A self-verification is initiated on command from the automation system or at the instrument itself (Figure 3). During self-verification, diagnostic routines perform checks and generate a report which can be used to verify the device is still working properly.
For example, commercial systems are available that fully comply with the requirements for traceable verification according to DIN EN ISO 9001:2008, Section 7.6a, “Control of monitoring and measuring equipment.” The instruments provide a self-diagnostics coverage of 94% or higher (in accordance with IEC 61508), and very low rates of undetected failures.
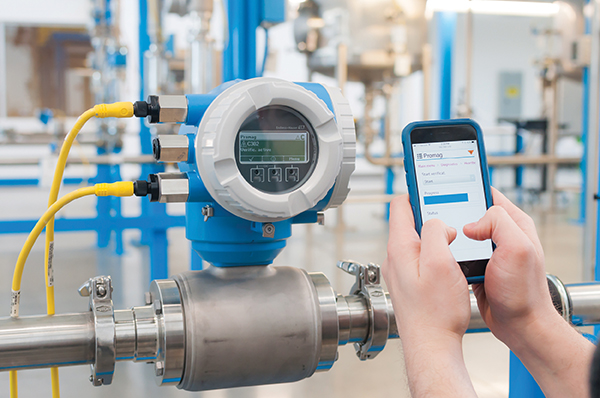
FIGURE 3. WLAN, Bluetooth
and Webserver interfaces
allow technicians to monitor,
diagnose and configure
instruments from smartphone
applications
Supporting software
With smart instruments, data are no longer just the primary process variables. They also include secondary process variables, sensor health, sensor performance characteristics, calibration information and realtime diagnostics. All this extended information can be used to improve the process, optimize instrument performance, extend instrument life and maximize productivity of maintenance personnel.
But it has to be obtained and then be processed by supporting software. Fortunately, all major instrument manufacturers supply the necessary software.
Typically, the solution is a standalone system that does not interfere with the control system operation. It continuously monitors and logs instrumentation health status and makes that information visible to responsible persons so they can take action as required. In combination with smart sensors, it can run online self-checks and verifications to lengthen the calibration intervals, give insights about the installed base, and help identify critical devices (Figure 4).
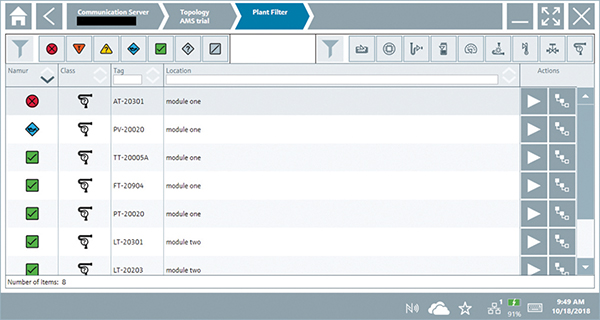
FIGURE 4. Display at a condition
monitoring’s HMI shows
the equipment health status
per NAMUR NE107
Processing all the data from a plant’s instruments can be challenging. For example, a chemical plant in Gendorf, Germany, has more than 4,000 instruments measuring level, flow, temperature, pressure and other primary process parameters. Attempting to employ the control systems for reading all the extended diagnostic information from all 4,000 devices, analyze it for problems, and issue instructions to the maintenance department would be a daunting problem.
Therefore, instrument manufacturers have developed specific software packages performing all those functions. The packages fall into two basic categories: instrument-management programs, which analyze realtime information from instrumentation; and asset-management software, which keeps track of every instrument in the plant and stores vital data, such as manuals and parts lists.
While a particular instrument manufacturer can provide information for its own instruments, what about all the other instruments in a plant from different manufacturers? Fortunately, standardization across the instrumentation industry makes that information available.
Device description (DD), enhanced device description language (EDDL), device type manager (DTM), HART and fieldbus configuration files are available from all manufacturers and can be accessed easily from various web sites, and then loaded into the instrument management program. These definition files enable interoperability among various automation system and instrumentation vendors.
When a plant has thousands of instruments, keeping track of manuals, parts lists, audit reports, maintenance schedules and other information can be a nightmare. A maintenance asset-management solution gathers all this information, digitizes it, and makes it available to maintenance technicians via handheld devices or the control system’s human-machine interface (HMI; Figure 5).

FIGURE 5. Instrument data from asset-management software can be accessed from
workstations or handheld devices
In addition to displaying instrument manuals, parts lists and compliance information, asset-management software tracks all instrument activities, including calibrations, verifications and maintenance performed to meet various industry and government regulations. The software can also produce audits and regulatory reports meeting government and industry standards.
The asset-management software also provides maintenance management. That is, it determines when instruments need to be serviced, calibrated or verified, and notifies maintenance staff. The software can share data with other maintenance management programs, historians and spreadsheets.
Author
 Howard Siew is a Chemical Industry manager at Endress+Hauser USA (2350 Endress Place, Greenwood, IN 46143; Phone: 888-363-7377; Email: howard.siew@endress.com). He is responsible for the overall business development and growth of the company position related to the chemical industry. Functional safety, technology innovation and application solutions are focal points. As part of his role, he is the U.S. representative on the global SIG (Strategic Industry Group), which helps development the long-term vision, brand, product direction and education of the company on industry direction. Siew is a chemical engineering graduate of Louisiana State University.