1.0 Introduction
Invented by the French in the 1890s as “artificial silk,” [1] Rayon is manufactured by regenerating naturally occurring cellulosic fiber. It is highly absorbent, soft and comfortable. Thus rayon has become a choice material for tampons. By cutting groups of spun rayon filaments into discrete lengths, called “staple,” it becomes much like cotton. Staple fibers range from 1.5 to 15 denier (denier is a unit of measure for thickness – 1 denier equals 1 gram per 9,000 meters).
To formulate a blend of rayon fibers that produces maximal tampon absorbency, a statistically based design of experiments (DOE) approach, developed specifically for mixtures, was taken advantage of. It produced a response surface map that allowed tampon manufactures to predict how rayon blends perform in terms of absorbency and other important attributes.
2.0 Mixture Design of Experiments
Mixture DOE’s are an efficient method for studying products made from the components at various levels.[2] As the number varied components increases, so does the number of blends. For example, a formulator who wishes to evaluate three ingredients that may exhibit nonlinear blending effects must produce at least six distinct blends to model such behavior. Equation (1) details this non-linear second-order model, called a “quadratic,” where Y represents the predicted response:
Y=β1A+ β2B+ β3C+ β12AB+ β13AC+ β23BC (1)
This equation contains six coefficients (the β’s ), so a minimum of six unique blends is required. The letter variables A, B and C represent the three individual mixture components. The second-order terms AB, AC and BC represents two-component interactions – better described as non-linear blending effects.
By restricting our experiment to three components, our design not only requires fewer blends, it also produces two-dimensional ternary plots (also known as “phase diagrams”) that provide complete information about the response-property at a glance.
Aided by specialized DOE software,[3] we conducted an experiment to reveal the complex effects of three different rayon fibers, characterized by denier, on tampon absorbency:
A. M-1127: Denier: 1.1, Staple Length: 1-9/16”, Soft Finish: Takemoto 60/40, TiO2: 0.0%
B. M-8575: Denier: 5.5, Staple Length: 2”, Soft Finish: RSF-15, TiO2: 0.0%
C. M-8257: Denier: 3.0, Staple Length: 1-9/16”, Soft Finish: Tween 20, TiO2: 0.6%
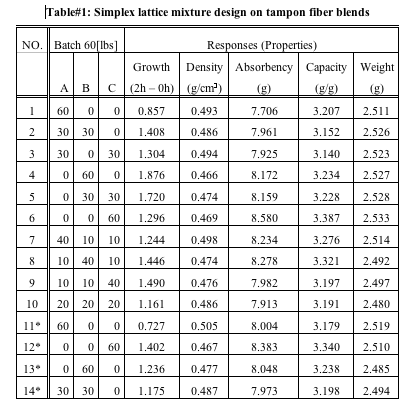
Fourteen rayon fiber blends, shown in Table#1, were prepared in 60-lb batches according to an augmented mixture design called the “simplex-lattice”. A simplex is a geometric figure with one more vertex than the number of components-dimensions. The three components we have here form an equilateral triangle. The textbook[4] lattice design provides the three pure components (corners of the triangle – numbers 1, 4 and 11 in the table) and the three two-component blends (mid-points of the edges – 2, 3 and 5). In addition to these 6 mixtures, the software specified the three-component ‘centroid’ blend (1/3rd of each – number 10 in the table) and 3 check-blends (7, 8 and 9), bringing the total of unique combinations to 10, of which four of these (*11-14, * asterisked) were suggested to be replicated to provide a measure of pure error for estimating potential lack of fit.
Each fiber blend was prepared as follows:
- Blend rayon staple fibers thoroughly;
- Card and draw different fiber blends to get slivers with 6.56 g/m;
- Condition slivers for 48 hours to reach equilibrium moisture about 11%;
- Slivers are used to form fiber mat in special tool;
- Cut fiber mat into 20 sample pads;
- Make 20 tampons from sample pads on lab-scale machine.
After measuring the properties for all tampons made from each blend, the results were averaged (see Table 1 for the data) and entered into the software for statistical analysis.
3.0 Findings
Although the lattice for this mixture design was built to support a second-order (quadratic) model, the augmented points suggested by the program provide for a fit of an additional term that captures three-component nonlinear blending, ABC, called the “special cubic.” Figure 1 shows an example of a special cubic surface that could potentially be revealed by the mixture design detailed in Table 1.
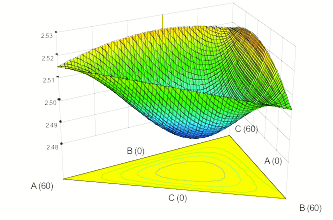
Figure 1: Special cubic non-linear blending that could potentially be discovered
With the aid of the software, the data from tampon response were fitted to linear, quadratic and special cubic mixture polynomial models. Linear terms sufficed for all measured responses excepting the weight, which exhibited no significant variation by blend (simply model this by the mean). Figure 2 shows the response surface for the primary response of absorbency. Notice its distinctly tilted planar shape, which is characteristic of a significant linear model. It reveals that material C, the three-denier rayon fiber, provides the maximum predicted result for absorbency.
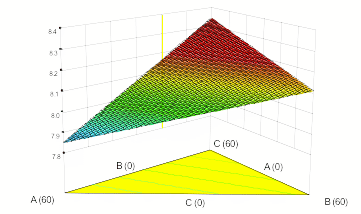
Figure 2: Response surface for absorbency
4.0 Conclusions
The three-denier rayon fiber provides the best tampon absorbency. This fiber represents the best combination of absorbent capillary suction and liquid retention under pressure. The next best material is the 5.5 denier fiber (“B”), but its lower absorbency means that liquid squeezes out too easily when the tampon is compressed. The very poor absorbency predicted for the 1.1 denier fiber (“A”) probably results from the incapacity of the restricted spaces between its filaments.
Maximizing all measured responses (excepting growth, which normally would be minimized, but in this case it did not vary significantly), the most desirable blend is flagged in Figure 3 – a graphic generated by the numerical multiple-response optimization tool in the DOE software. It predicts better overall properties by blending in a small amount of the low-denier fiber. Obviously this requires a tradeoff of absorbency for the benefit of capacity and density. Follow up work will be needed to explore this optional blend.
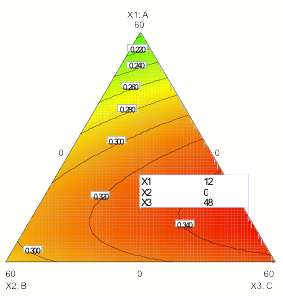
Figure 3: Most desirable blend of rayon components taking all properties into account
References
- “Rayon – The Multi-Faceted Fiber,” Joyce A. Smith, Ohio State University Extension Fact Sheet HYG-5538-02, Textiles and Clothing, Columbus, OH.
- “Find the Optimal Formulation for Mixtures,” Mark J. Anderson and Patrick J. Whitcomb, Chemical Engineering Progress, April 1998.
- Design-Expert®, Stat-Ease Inc., www.statease.com, Minneapolis, MN.
- Experiments with Mixtures, 3rd Ed., John A. Cornell, 2002, J. Wiley, NY, NY.
About the authors
Zivorad R. Lazic is a Senior Research Scientist in BASF Catalysts LLC., Gordon, GA (478-628-7307). He earned his PhD from Belgrade University-Yugoslavia in chemical engineering. Zivorad is the author of Design of Experiments in Chemical Engineering: A Practical Guide published by J. Wiley in January, 2005. Before joining BASF, he worked as a chemical engineer and quality assurance manager at Lenzing Fibers Corporation. He is a certified six-sigma green belt with interests that include advanced statistical tools, design of experiments (DOE), statistical process control (SPC), evolutionary operation (EVOP) and process modeling via application of neural networks.
Mark J. Anderson a principal of Stat-Ease, Inc., Minneapolis, MN (612-746-2032). After achieving his undergraduate degree in chemical engineering from the University of Minnesota, he went on to complete his MBA. Mark co-authored two books, DOE Simplified: Practical Tools for Effective Experimentation and RSM Simplified: Optimizing Processes Using Response Surface Methods for Design of Experiments. He has published numerous articles on design of experiments (DOE). Mark is registered as a Professional Engineer (PE) in the State of Minnesota and he is a Certified Quality Engineer (CQE).