Predicting powder flow behavior is important to successful solids-handling processes. Provided here is a review of shear-cell testing and how the technique can be used to predict arching, ratholing and other behaviors
The phrases “failure to discharge” and “erratic flow in the hopper” are sometimes heard from frustrated production-floor workers when powder processes start to misbehave. Taking corrective action for these types of problems may involve shutting down the process to investigate the root cause. Ideally, processors would identify suspect powders prior to processing, thereby avoiding costly downtime. Traditional methods for predicting flow behavior — flow cup, angle of repose and tap tests — are giving way to shear-cell testing, which measures inter-particle sliding friction, as well as powder-to-hopper wall interfacial friction. This article explains the science behind shear-cell measurements. Predictions for density-compaction ratio, potential arching dimension or rathole diameter, and design requirements for hopper half angle to achieve mass flow are reviewed.
Types of powder flow behavior
Figure 1 illustrates two common flow types. “Core flow” is the default discharge pattern experienced on the production floor. When the feed bin is filled with powder, the material’s behavior can be characterized as “last-in, first-out.” Powder flows from the top of the vessel downward through a vertical channel above the outlet. Material around the walls remains static until the fill level reduces to expose stationary particles, which now become the top free surface. If powder is refilled into the hopper regularly, material near the bottom of the vessel may remain in place for long periods of time until the vessel drains to empty. Potential dangers include compaction of the stationary powder and potential caking or bridging in the hopper outlet. Powder that remains stationary for too long a time risks spoilage or other problems related to aging material.
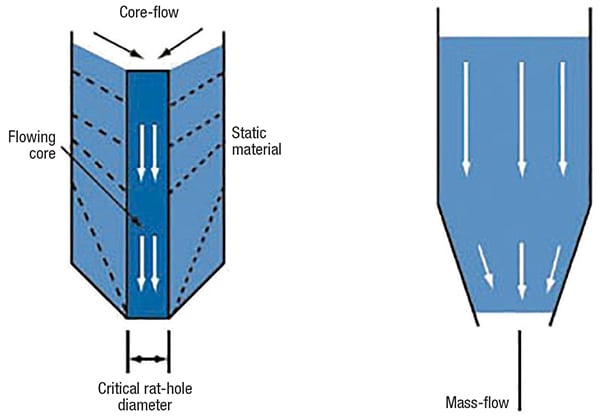
Figure 1. The diagram shows core flow (left) and mass flow (right) patterns
Many companies in the chemical process industries (CPI) experience flow problems and core flow behavior due to the cohesive nature of powders, such as carbon black and calcium carbonate.
Mass flow is the preferred discharge pattern. The flow behavior in this case can be characterized as “first-in, first-out.” In mass flow mode, powder throughout the bin is in motion simultaneously, including particles in close proximity to the wall. One important advantage of mass flow is that blended powders undergoing mass flow in a hopper generally maintain their compositions, whereas blended powders tend to segregate with core flow.
Time consolidation
Consolidation of powders can occur when powders fill and occupy a vessel. Powders may increase their internal strength (also known as “failure strength”) from the initial moment they fill the bin. The weight of powder pushes down on particles below due to gravity, so powder at the bottom of the vessel experiences the highest compaction stress. Air gradually squeezes out from empty spaces between particles. Consolidation takes place as particles move closer together. Increases in powder strength depend on the amount of time the powder remains stationary and undisturbed. Like a packed snowball, the powder can reach a state where it cakes and resists movement when discharge out the hopper finally commences.
Powder density
Measuring the compressibility of a powder is one experimental way to predict flow behavior. The greater the extent that a powder compresses together, the greater its powder strength. One possible consequence of this higher powder strength is that powder flow becomes increasingly difficult.
The tap test is an established method for measuring compressibility of powders. In a tap test, an empty cylinder of fixed volume is filled to the brim with the powder. The cylinder is tapped up and down a defined number of times (perhaps 100 or 150 repetitions). After the tapping, the reduced fill level of the powder is measured, then divided by the initial fill level to calculate the compressibility ratio. Tap tests can be accomplished relatively quickly, but they provide only two data points on a curve — namely the loose fill density and the compacted density after a defined number of taps. The tap test may be run several times to determine the steady state for maximum compaction after the defined number of taps.
A rule of thumb is that powders that compress more than 35% from the loose-fill condition in the tap test may exhibit flow behavior problems in powder handling operations. An observation of 50% compressibility is a sure indication that processing will have challenges related to powder flow, especially if there is any downtime after the powder is placed in the bin or hopper.
Powder mechanics and obstructions
Fundamental to predicting powder flow is analyzing inter-particle friction. Resistance to movement in powder processing is due to sliding friction between particles, as well as interfacial friction between the powder and the hopper surface.
Three types of obstructions may occur to prevent discharge from a bin. The “mechanical arch” involves large particles interlocking with each other and blocking the outlet. A “cohesive arch” occurs when powder at the bottom gains sufficient strength due to consolidating stresses that it solidifies and bridges the outlet. “Rathole” formation takes place when the powder in a vertical core above the outlet discharges and powder throughout the rest of the vessel remains static.
Segregation is a problem that may result during blockages. Particles of differing shapes and sizes separate across the cross-section of a vessel or hopper. One typical pattern of segregation is an increase in fine (smaller) particles near the central axis of the vessel and a greater concentration of coarse (larger) particles near the outer walls.
Annular shear cell
Over 50 years ago, the minerals industry devised a technique to quantify sliding friction behavior during powder discharge from a bin by measuring aggregate shear forces between particles in a controlled sample. This initial experimental work led to the development of the “annular shear cell,” a chamber that holds the powder sample, allows it to be consolidated, and then exposes it to uniform shearing forces in order to measure the yield stress necessary for relative movement. Figure 2 shows typical shear-cell components.
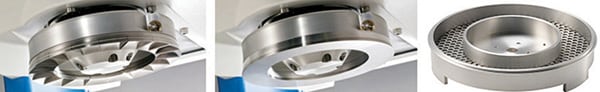
Figure 2. The components of a shear cell tester include the vane lid (left), wall friction lid (middle) and the trough (right)
The annular cell in which the powder is placed has a well-defined volume. Various chamber sizes are available to accommodate whatever amount of powder is available for testing. The shear cell is then placed onto the “powder flow tester” instrument. A lid affixed to the compression plate on the instrument descends onto the sample and consolidates the powder to a defined stress value. Reduction in the sample volume as powder particles push together is automatically measured by the instrument. This procedure for consolidating the powder using a defined stress is repeated multiple times to verify that the powder has achieved “critical consolidation,” meaning that particles have reached an equilibrium condition with relative spacing.
There are two types of lids used on the instrument, one to measure interparticle friction (vane lid), the other to measure wall friction, which simulates powder sliding against the hopper wall prior to discharge (wall friction lid). The test procedure, regardless of lid type, involves compressing the powder at increasingly higher stress levels to evaluate change in powder strength. At each consolidating stress level, the trough rotates slightly on the instrument turntable and powder friction is measured.
Density measurement
As the annular shear-cell test progresses, the reduction in sample volume is measured and the powder bulk density is calculated. Figure 3 shows graphical data for different powders from the density test. The x-axis is the consolidating stress, in units of kiloPascals (kPa) and the y-axis is the bulk density in kilograms per cubic meter. Software used with powder flow instruments typically has flexibility with regard to the choice of scientific units when reporting data. The loose-fill density at the beginning of the test is shown by the left-most point on the graph, representing the powder condition when it is first poured into the bin. Bulk density values increase as the test progresses and normally approach an asymptotic value as consolidation of the powder reaches a maximum. The amount of consolidation between the loose-fill condition and the maximum density is expressed as a compressibility ratio. This numerical value is comparable to industry standard calculations from the tap test described previously, namely the Carr index and the Hausner ratio.
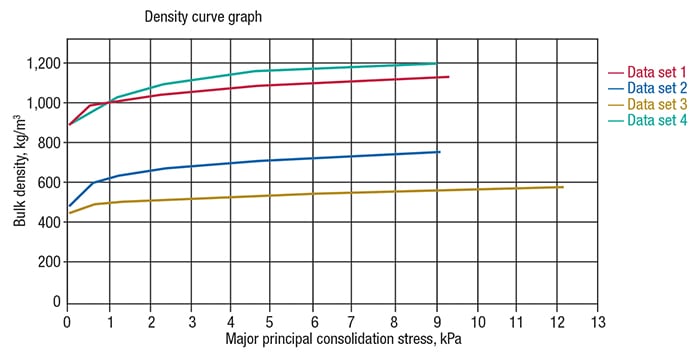
Figure 3: In a density curve, the x-axis shows the consolidating stress, and the y-axis shows bulk density
Flow function test
The vane lid is used to perform the flow function test. Powder strength is measured as “yield stress” by shearing particles trapped in the lid pockets against particles in the shear cell. Powder strength data at each consolidating stress are plotted on the graph in Figure 4 to produce a graph called a “flow function.” The solids-handling industry has established regions of flow behavior, as indicated in the figure, ranging from “free-flowing,” along the x-axis, to “non-flowing,” along the y-axis. Powders that are likely to exhibit flow difficulty in solids-handling processes are typically those that fall into the “cohesive” or “very cohesive” categories. These powders would be primary candidates for flow-aid additives to reduce internal friction between particles.
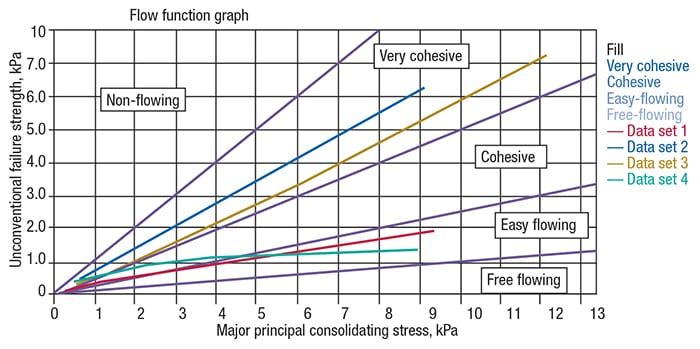
Figure 4: Powder strength data at each consolidating stress are plotted to create a flow function graph
Wall-friction test
The wall friction lid is used for this test. The material of construction used for the lid surface is based on actual hopper design — instrument vendors provide a range of offerings for different grades of steel and plastic routinely used in hopper construction. The test method for wall friction measures interfacial friction between the powder sample and hopper wall material at increasing consolidation stresses. Figure 5 shows a graph of wall friction behavior for various powders. Wall friction angles above 30 deg are considered high, and may lead to flow difficulty in powders.
One important point to note about hopper walls is that powder buildup may occur over time during processing. This can be simulated in the wall friction test by conditioning the lid accordingly and measuring the change in yield stress between the lid and powder sample. The general observation is an upward shift in the curves shown in Figure 5, which means greater resistance as powder slides down the hopper wall during discharge.
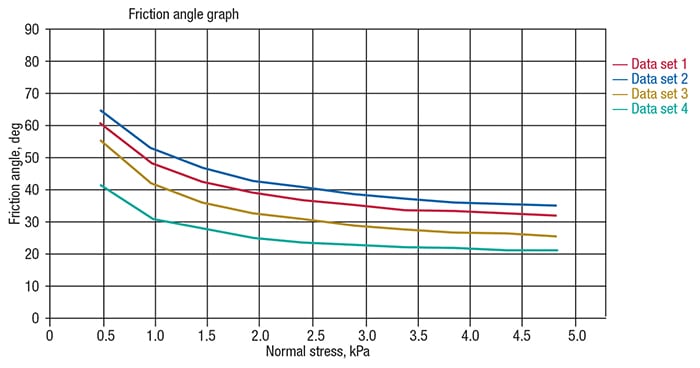
Figure 5: Different powders will show different wall-friction behaviors
Arching dimension and ratholes
Critical arching dimension is a conservative calculation of powder in mass flow that describes what conditions are necessary to build a stable bridge over the hopper outlet, thereby restricting discharge. The method for making this determination involves identifying the “critical consolidating stress.” Software provided by instrument vendors will establish a hypothetical line, referred to as a “flow factor,” which intersects the flow function. The point of intersection is known as the “critical consolidation stress.” Given this value, it is possible to perform calculations to determine the arching dimension and rathole diameter.
Hopper half angle for mass flow
By integrating data from both the flow function and wall friction tests, it is possible to calculate a value for the hopper half angle that will enable mass flow behavior to take place. Software provided by instrument vendors automatically performs this calculation.
Practical design considerations
Some powders require such steep slopes for hopper half angle (greater than 80 deg relative to horizontal) that equipment designs capable of meeting the requirement are not practical. These designs would result in discharge hoppers at the bottom of the bin that could be taller than the bin itself.
Many processors at solids-handling facilities are limited to the use of equipment that is already in place, and cannot make design changes to replace equipment. Two possible alternative options for finding solutions to flow problems could include changes in hopper wall material or an increase in cleaning frequency for the hopper surface.
Another approach for improving flowability is to incorporate additives into the powder formulation. Similarly, mechanical-assist devices, such as vibration and aeration, are other possible considerations. Trade-offs must be evaluated between the cost of these interventions versus the consequences of the lost processing time due to flow stoppages related to equipment downtime or poor product that requires rework.
The objective is to know before each process run what difficulties lie ahead. The flow function test has been streamlined to under 20 minutes for five consolidation-stress setpoints and under 12 minutes if two consolidation-stress setpoints are practical for providing a quick go/no-go assessment. This test gives a useful indicator for potential problems and puts the processor in a better position to respond in advance, thereby avoiding unexpected stoppages.
Edited by Scott Jenkins
Editor’s note: For more information on shear-cell testing, see Chem. Eng., April 2016, pp. 50–59, and Chem. Eng., January 2016, pp. 58–63.
Author
 Robert G. McGregor is the director of global marketing at Ametek Brookfield Instrumentation and Specialty Controls Division (11 Commerce Boulevard, Middleboro, MA 02346; Phone: 508.946.6200 ext 7143; Email: bob.mcgregor@ametek.com; Website: www.brookfieldengineering.com). McGregor holds M.S. and B.S. degrees in mechanical engineering from the Massachusetts Institute of Technology (MIT) in Cambridge, Mass.