This practical framework can help engineers transition their heat-exchanger diagnostics from after-the-fact investigation to continuous, chemistry-aware forecasting
Chemical producers are pushing the limits more than ever. In addition to extending turnaround intervals from 3–5 years to 7–9 years, ethylene producers are pushing coil outlet temperatures higher to maximize ethylene yield. This accelerates coke deposition and pushes tube temperatures to thermal limits. The unintended consequences of higher temperatures often surface downstream. The high-severity operation forces equipment like the cracked gas compressor (CGC), refrigeration systems, intercoolers and distillation columns to operate close to maximum design capacities. The combination of all of these factors makes hitting a nine-year turnaround target very hard. Few pieces of equipment are as quietly consequential to a chemical plant’s margins as its heat exchangers or intercoolers. An ethylene complex may operate several hundred shell-and-tube heat exchangers across the quench, compression and separation sections. When one of these exchangers underperforms, the loss rarely announces itself with an alarm. It shows up as a furnace burning a little more fuel, a column running a little hotter, a compressor pulling a little more amperage — small deviations that accumulate into six- and seven-figure penalties before anyone schedules an investigation (Figure 1).
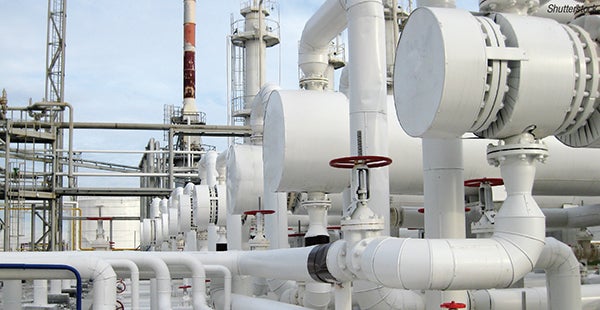
FIGURE 1. Most chemical plants employ numerous heat exchangers, giving their performance characteristics an outsize impact on plant margins
A root-cause failure analysis (RCFA) is typically commissioned only after the failure has already racked up a significant cost that needs an explanation and mitigation plan. The exchanger is pulled, the bundle is inspected, deposits are sent to a laboratory and a report is written explaining what went wrong. This is useful, but it is fundamentally a postmortem, completed mostly by the team being paid to prevent problems from happening. The purpose of this article is to trace how RCFA is evolving — from that retrospective exercise toward a continuous, predictive discipline, which can build better relationships and drive improved decision-making — and to offer practical guidance for engineers who want to make a similar transition in their own units.
Physics that RCFA must untangle
Every heat-exchanger failure investigation is really an attempt to separate four intertwined phenomena: heat transfer, fouling, corrosion and hydraulics. They are all interlinked, and that coupling is what makes diagnosis difficult.
The governing relationship is deceptively simple. A heat exchanger’s duty is set by the product of its overall heat-transfer coefficient ( U), its area ( A) and the log-mean temperature difference (LMTD) driving the transfer. Area is essentially fixed and LMTD is dictated by the process. The variable that carries the story of a failure is U — and U is a series-resistance network comprising the film coefficients on each side, the tube-wall conductance and, critically, the fouling resistances that accumulate on both surfaces (Figure 2).
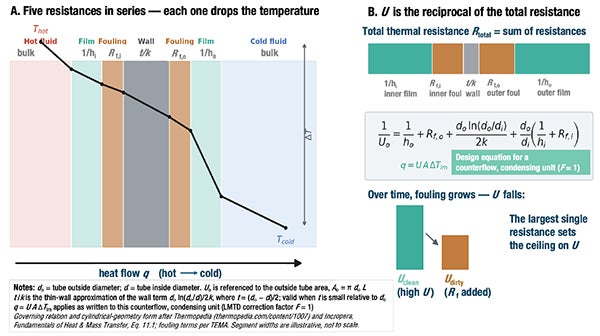
FIGURE 2. The heat-transfer coefficient U bundles the whole heat-transfer journey — hot film, inner fouling, wall, outer fouling and cold film — into one number; essentially, the reciprocal of the sum of resistances in series
The trouble is that a drop in apparent Ucan originate from several unrelated mechanisms, including the following:
- Fouling and scaling add a resistance layer. In a petrochemical service, this may be coke or polymer buildup on the process side, or calcium carbonate, phosphate and biofilm on the cooling-water side
- Corrosion can either roughen a surface and increase turbulent heat transfer briefly, or produce voluminous oxide deposits that behave like fouling — while simultaneously thinning the tube wall toward a mechanical failure
- Hydraulic problems — maldistribution, tube plugging, bypassing around baffles or simple flow starvation — reduce the film coefficient and mimic fouling in the thermal data, even though the surfaces may be clean
A clean exchanger starved of flow and a full-flow exchanger covered in scale can present nearly identical duty losses. An RCFA that stops simply at “the exchanger fouled” without distinguishing these mechanisms will prescribe the wrong fix. For instance, more frequent cleaning could be suggested for what is actually a distribution problem, or a chemical program change for what is actually a corrosion issue.
Traditional toolkit hits and misses
The RCFA toolkit remains valuable and should not be discarded. Periodic bundle inspection helps operators and water treaters understand deposit morphology and location in ways that no sensor can. Deposit analysis (such as loss on ignition, X-ray diffraction or elemental scans) identifies whether the layer is organic, inorganic or biological, and often points directly at the source. Cleaning records, when diligently kept, establish fouling rate and the interval at which duty degrades to an unacceptable level, and also serve as a benchmark for how to improve. And a snapshot thermal calculation performed against a clean-condition datasheet quantifies how far the exchanger has drifted from design.
The limitation is not accuracy but timing and resolution. Each of these methods samples the exchanger at a single point in time — usually after performance has already been lost, and often after the plant has decided to clean regardless of what the analysis shows. Frustratingly for third-party consultants and subject-matter experts who are summoned to sites to inspect heat exchangers during a turnaround or opportunistic opening, many plants will pre-emptively hydroblast equipment or punch tubes, which renders further inspection of the failure mode completely moot.
A snapshot calculation captures one operating state and cannot tell whether the deposit built up gradually over months or stepped up abruptly after a process upset. The mechanism that caused the failure is frequently obscured by the time anyone looks because the evidence has been washing through the system throughout the entire interval.
In other words, the traditional toolkit answers what failed with authority but is weak at ascertaining when and why it accelerated. These are precisely the questions that prevent recurrence. However, these traditional analyses take on new meaning as we move to modern monitoring and predictive digital twins where they serve as anchor points and training references for models, which will be discussed further later in this article.
Continuous U-value tracking
Engineers have been calculating the U-coefficient for years by hand (usually in Excel spreadsheets), and presenting the information in PowerPoint presentations. But with fewer engineers and more being asked of them to increase efficiencies, automation of a simple calculation can be a practical bridge to improving performance. Tracking the overall heat-transfer coefficient continuously from data already being collected is simple. Data are the basis for every calculation and model. The model is only as good as the data you provide. Every shell instrumented with inlet and outlet temperature measurement on both streams, plus flow measurement, contains enough information to back-calculate a working U on whatever interval the historian records. The challenge we always run into is that plants have the sensors on the process side, but not on the water side. The good news is that implementation is relatively inexpensive with non-invasive equipment. It often requires only a couple thousand dollars for a Class I, Division II/ATEX environment, and newer independent software systems allow for automated upload of heat-exchanger datasheets, near real-time continued calculation, warnings, notifications and modeling for only a couple hundred dollars a month.
These commercial implementations have made this approach mainstream. These systems convert routine plant measurements into a normalized heat-transfer performance indicator and trends it against a clean baseline, flagging degradation before it becomes a duty problem. The value of such methodologies is less in any proprietary calculation than in the discipline they enforce: they turn a periodic snapshot into a continuous signal. Doing this well requires three practical habits.
1. Normalize for process variability. Raw U wanders with throughput, feed composition and cooling-water temperature — none of which necessarily indicate a failure. The useful signal is the cleanliness factor, the ratio of observed U to the U the exchanger would deliver clean at the same operating conditions. Computing that reference U at each timestamp, rather than comparing against a single design point, is what separates a real fouling trend from seasonal noise.
2. Use the fouling resistance, not just duty. Converting the U trend into an accumulated fouling resistance (the reciprocal- U, difference from clean) linearizes the problem (Figure 3). A steady, linear rise is classic particulate or crystallization fouling and is highly predictable. A sudden step points to an event — a slug of contaminant, a loss of treatment, a flow excursion. An asymptotic curve that flattens suggests a self-limiting deposit. The shape of the fouling curve is diagnostic in itself, and it is only visible with continuous data.
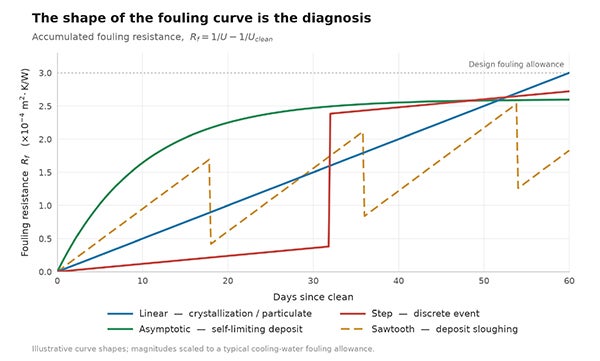
FIGURE 3. Fouling resistance can provide important diagnostic information related to heat-exchanger performance and failure
3. Cross-check thermal loss against hydraulics. This is the discriminator that continuous monitoring makes possible and snapshots cannot. If duty falls while pressure drop climbs, the flow area is constricting — usually due to deposits or plugging. If duty falls while pressure drop also falls or holds flat, it is more likely flow starvation, bypassing or maldistribution, not fouling at all. Pairing the U trend with a differential-pressure trend resolves what is often the most common misdiagnosis in exchanger RCFA. In an ethylene quench-water service, for instance, this pairing routinely separates genuine hydrocarbon fouling from a distributor that has begun to bypass. Adding a pressure sensor to the sensor package adds yet another level of fidelity to the heat exchanger model.
With these three habits, an engineer can distinguish scaling, fouling and flow degradation in near real time, and can date the onset of a problem to the shift on which it began, thus closing the “when and why” gap that defeats postmortem analysis.
From monitoring to prediction
Continuous U-tracking indicates when an exchanger is degrading and helps you classify the mechanism. It does not, on its own, tell you what will happen next or what to do about it. That is the province of the digital twin — and it is here that RCFA finally becomes proactive.
A useful exchanger twin is not a 3-D rendering or simple dashboard. It is a first-principles thermal-hydraulic model of the specific shell, continuously reconciled against live process data, and increasingly informed by the chemistry of the fluids passing through it (Figure 4). The first-principles core predicts clean-condition performance at any operating state, which is exactly the moving reference the cleanliness-factor calculation needs. The live data reconciliation keeps the model honest against the real asset. And the chemistry layer (water analysis on the cooling side, feed characterization on the process side) supplies the driving forces for the fouling and corrosion mechanisms the model is trying to forecast.
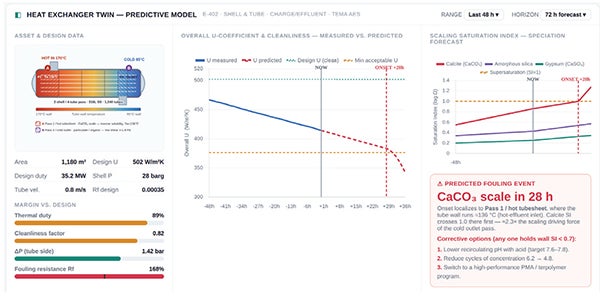
FIGURE 4. A digital twin of a heat exchanger can predict chemical parameters, tube-wall surface state, and potential failure modes and timing, often before a cleanliness factor would even indicate a change
That chemistry layer is what most distinguishes a genuinely predictive twin from a curve-fit. Fouling rate is not a fixed property of an exchanger; it is a function of what is flowing through it. On the cooling-water side, scaling potential rises steeply with cycles of concentration, pH, and skin temperature. Real-time speciation, saturation and kinetics analysis inform the state of the heat exchanger at any given point and can be run forward to predict what will happen. On the process side, coking and polymerization rates in an ethylene plant depend on wall temperature and residence time. A twin that carries these relationships can do something monitoring alone cannot: it can forecast the fouling trajectory forward and test interventions before they are made. The newest models can use computational fluid dynamics (CFD) mesh models to analyze thousands of zones within a single heat exchanger at the same time, truly profiling the heat exchanger, what types of scale will form in which areas, where it is prone to biofilm, expected corrosion impact and more.
Machine-learning (ML) techniques and artificial intelligence (AI) have a legitimate role here, but a supporting one. Data-driven models are excellent at capturing residuals the first-principles model misses — the plant-specific quirks, the soft correlations between an upstream unit’s swing and a downstream exchanger’s fouling. Used as a correction layer on top of a physical model, these models improve accuracy and provide early-warning classification. Used alone, without physical constraints, they extrapolate poorly and fail exactly when a novel failure mode appears, which is the moment an RCFA tool is most needed. And those core RCFA tools mentioned earlier are now needed more than ever. Used as anchor points in advanced models, these results train and validate the models so they become more accurate over time.
The payoff of assembling these layers is a diagnostic tool that updates continuously and looks forward.
Forecasting failure modes. The digital twin projects when cleanliness will cross an operability limit, and its chemistry inputs indicate which mechanism will get there first: scale, biofilm or process-side deposit.
Optimizing chemical treatment. Because the twin links water chemistry to fouling rate, it can evaluate whether tightening cycles, adjusting inhibitor dose or changing a biocide program will actually extend run length, before spending money to find out.
Improving reliability. Cleaning is scheduled against a predicted trajectory rather than a fixed calendar or a duty alarm, and corrosion-driven wall loss is tracked alongside thermal loss so a mechanical failure is not mistaken for simple fouling.
Making the transition
None of these steps requires ripping out existing plant practices, and the transition doesn’t have to be expensive. The path is incremental and each step stands on its own (see sidebar at bottom). Begin by instrumenting the exchangers that matter most and computing a normalized cleanliness factor from data already in the historian. Add the differential-pressure cross-check to stop misdiagnosing flow problems as fouling. Build a first-principles reference model for the critical services so the cleanliness baseline moves correctly with operating conditions. Chemistry speciation models are already available and can provide guidance without a full twin implementation, but layering in chemistry and machine-learning corrections will help to turn the trend into a forecast. And what about the cost? Many suppliers will promote the idea that this could require hundreds of thousands or millions of dollars to implement, but when you start to look at progressive-fidelity digital twins, the numbers make much more sense. The question is how much fidelity do you need to make a good decision? Is it a few thousand dollars to properly model your critical bottleneck? Or is it a system-wide energy efficiency and automation project with AI in the decision loop? It will be different for every plant.
The traditional RCFA toolkit does not disappear in this progression — it becomes the ground truth that validates the models. Deposit analysis confirms what the chemistry layer predicted; a turnaround inspection calibrates the twin. What changes is the center of gravity: the investigation stops being an event triggered by a loss and becomes a continuous property of the asset.
For chemical and petrochemical operators running fleets of exchangers on tight margins, that shift is not a luxury. A preheat train that fouls a season early, an ethylene quench system that loses duty between turnarounds, a cooler that corrodes toward a leak — each is a failure that continuous, chemistry-aware analysis can see coming. Moving RCFA from postmortem to prediction is, ultimately, about buying back the months of warning that the old toolkit gave away.
The Progressive-Fidelity Ladder for Heat-Exchanger Root-Cause Analysis
None of these suggestions requires ripping out existing practice, and the transition need not be expensive. The path is incremental and each step stands on its own — begin at the exchanger that matters most and climb only as far as the decision actually requires. The traditional RCFA toolkit does not disappear — deposit analysis and turnaround inspection become the ground truth that validates each model. What changes is the center of gravity: the investigation stops being an event triggered by a loss and becomes a continuous property of
the asset.
1. Instrument what matters
Compute a normalized cleanliness factor from data already in the historian.
2. Add the ΔP cross-check
Use differential pressure so flow problems are not misdiagnosed as fouling.
3. Build a first-principles reference
A physics baseline moves the cleanliness benchmark with operating conditions.
4. Layer in chemistry speciation
Speciation models guide action now — no full digital-twin build required.
5. Add chemistry + ML forecasting
Corrections turn the cleanliness trend into a forward-looking forecast.
Acknowledgment
All images provided by author unless otherwise noted
Author
 Jim Green (Email: jim.green@industrialwateradvisory.com; Phone: 1-445-456-1640) is the founder and principal consultant of Industrial Water Advisory, an independent, vendor-neutral industrial water consulting practice. He advises owner-operators in the chemical, petrochemical, refining, data center and power sectors on technical water treatment issues, RFP and contract design and compliance, root-cause failure analysis, Legionella, and as a retained expert witness. He has over 30 years of expertise and is most recently focused on digital twin and AI technology incorporation into legacy manufacturing. Green writes and speaks regularly in the industry.