RTD sensors will never exhibit behavior based on theoretical ideals, but understanding the fundamentals behind transmitter-sensor matching will enhance their accuracy
Temperature is the most common measurement in the chemical process industries (CPI). It is employed for a wide variety of purposes ranging from simple monitoring to the control of critical processes. If monitoring and trending are the ultimate goals, a stable, highly repeatable measurement is all that is typically required. However, when temperature measurement is being used for process or quality control, the accuracy of the reading is much more crucial. An example of a resistance temperature detector (RTD) in a monitoring application is on the inlet and outlet tube temperatures of a heat exchanger. Over time, the tubes of a heat exchanger will become fouled, and heat transfer will become less efficient. This efficiency drop is indicated by a reduced difference between the inlet and outlet temperatures, which can be monitored to ensure that proper heat exchange is occurring. The operators who are responsible for controlling critical chemical processes — where reliable temperature information is required — must be certain that offsets in temperature measurements do not develop over time. The control system will act as it is programmed, based on the measurements it receives. Still, operators’ skills are required to oversee what the control system is managing. Sometimes, even small shifts in reactor-temperature measurements can help guide an experienced operator or equipment-maintenance personnel to question the functionality of the process equipment or the process itself. Those responsible for process-optimization initiatives — where the objective is to fine-tune the efficiency or throughput of a process unit — depend on reliable trending data to make decisions on process adjustments. For example, it is extremely undesirable for the temperature information that is analyzed while troubleshooting or benchmarking the performance of a distillation column to be compromised by an RTD offset somewhere in the data trends or history. It goes without saying that an understanding of RTD accuracy and what data readings actually mean is important for personnel working in many different plant roles.
How accurate is an RTD?
When precise control is the goal, this leads to the inevitable question: “What company manufactures the most accurate RTD?” This is the wrong question. The question that should be asked instead is: “Does a particular company manufacture RTDs in compliance with International Standard IEC 60751?” IEC 60751 specifies the ideal resistance-to-temperature relationship. It also qualifies the RTD classification concept, providing tolerances for each classification, as well as defining test procedures. The ideal curve established by IEC 60751 for RTDs is the theoretical relationship between the resistance output, given in ohms (Ω), of the temperature probe and the temperature of the process. Unfortunately, no RTD ever follows this ideal curve. Component differences, such as wire diameter or manufacturing tolerances, prevent the temperature probe’s performance from matching the ideal curve. Consequently, IEC 60751 has identified four classifications (Figure 1) to quantify the accuracy of individual RTDs. The four classes are as follows:
- Class AA allows a tolerance of±0.1°C at 0°C — this is the smallest tolerance, or minimal allowable deviation, from the ideal curve.
- Class A allows a tolerance of±0.15°C at 0°C.
- Class B allows a tolerance of±0.3°C at 0°C.
- Class C allows a tolerance of±0.6°C at 0°C — this is the largest tolerance for deviation from the ideal curve.
Testing to determine an RTD’s classification is always performed at a controlled temperature of 0°C (Figure 2), the only valid test point, according to IEC 60751. This classification, and not the manufacturer of the RTD, is what determines RTD accuracy. From Figure 1, it is seen, per IEC 60751, that Class AA RTDs provide the highest levels of accuracy.
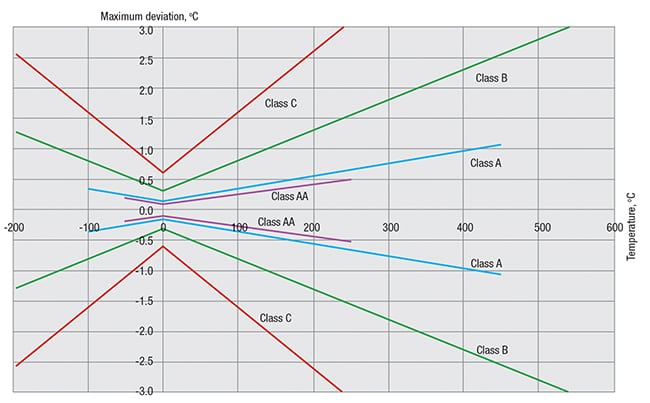
Figure 1. From IEC 60751 standards, RTDs can be categorized into four classes based on their accuracy
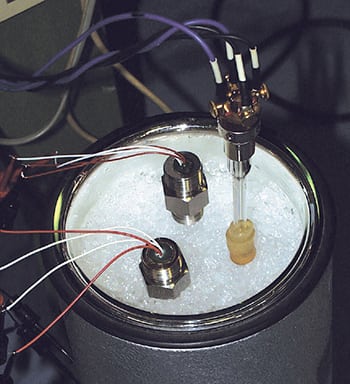
Figure 2. RTD probes are immersed in an ice bath at 0°C for testing and classification purposes
However, once RTD accuracy is understood, more questions may still remain. What avenues are available if an RTD is being used for process control, and the standard tolerance bandwidth according to IEC 60751 is not sufficient? A solution for improving temperature-measurement accuracy comes in the form of transmitter–sensor matching.
The ideal curve is not ideal
The default information that is programmed into a temperature transmitter is based upon the ideal curve. The ideal curve used in this article (Figure 3) is based on a Pt100 RTD.
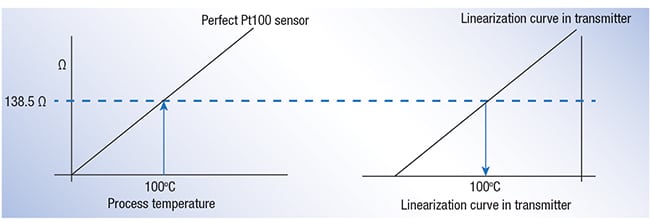
Figure 3. In a perfect world, the linearization curve will match the actual temperature, but this is not the case, due to a number of real-world factors
The term Pt100 identifies the base resistance value for the RTD at 0°C. In this case, Pt100 means that this particular style of RTD will have a resistance of 100 Ω at 0°C. While Pt100 RTDs are the most commonly used devices in industry, there are other styles employed as well, such as Pt500 (500 Ω resistance at 0°C) and Pt1000 (1,000 Ω resistance at 0°C). These designations also identify the changes in resistance the unit will produce per 1°C change in process temperature, as follows:
- Pt100 = 0.385 Ω/°C
- Pt500 = 1.95 Ω/°C
- Pt1000 = 3.85 Ω/°C
The vast majority of industrial RTDs are Pt100 devices. The primary reason for choosing a Pt500 or Pt1000 is for improved resolution due to the larger slope of their resistance change per degree Celsius. For a Pt100 RTD at a given resistance value, the transmitter assumes that the corresponding process temperature matches the ideal curve for a Pt100 RTD, as shown in Figure 3. As previously explained, this will not be the case. For example, using the ideal curve for a Pt100 RTD, the resistance at a process temperature of 100°C would be 138.5 Ω. This is also the information that the associated transmitter is expecting to see. However, this particular RTD actually provides a resistance value of 138.2 Ω when the process temperature is 100°C. A transmitter using ideal-curve programming will provide the control system with a temperature value of 99.2°C based upon the 138.2 Ω resistance value it receives, versus a temperature value of 100°C for this resistance. This produces a 0.8°C measured error, as seen in Figure 4.
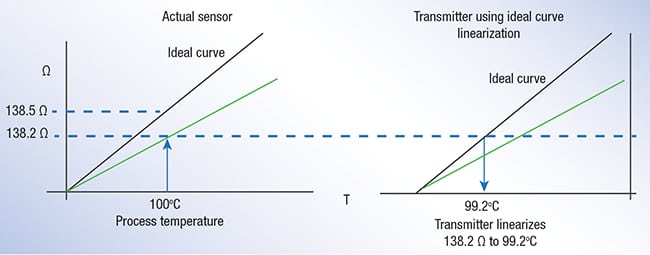
Figure 4. Standard linearization techniques in a temperature transmitter will produce errors. Here, the error is 0.8°C. The left side shows the comparison between the actual temperature sensor resistance value (green) and the ideal curve value at 100°C. The right side shows what the transmitter is going to actually generate as the value to the control system (black), which is 99.2°C
IEC 60751 identifies a process for platinum Pt100 RTDs where an equation developed by Hugh Longbourne Callendar and M.S. Van Dusen can be used to identify the unique performance curve for an individual RTD. This equation, called the CVD equation, is given in Equation (1). For a more detailed discussion of the CVD equation, please see the box in Part 1 of this Feature Report on p. 44. R T= R0[1 + AT + BT 2+ C ( T –100) T 3] ( 1) In the CVD equation, R T is resistance at temperature T, R0 is the resistance when T = 0°C, and A, B, and C are constants, commonly referred to as CVD coefficients. These values are specifically derived from each RTD sensor during calibration using laboratory-controlled baths at predetermined temperatures. The actual resistance at each of these points is recorded and used to develop the CVD constants, and to produce a performance curve unique to that specific RTD. The CVD constants developed from the testing process are then programmed into the corresponding transmitter that is mated with the RTD temperature sensor. This produces a much more accurate linearization curve for that specific probe, and allows for optimal system accuracy. If transmitter-sensor matching is performed on the RTD described in Figure 3, the 0.8°C error will be eliminated, producing a much more accurate measurement, as seen in Figure 5.
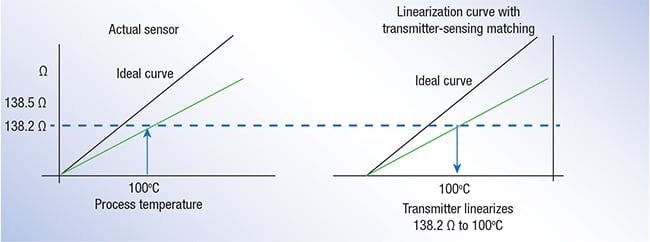
Figure 5. Transmitter–sensor matching produces a more accurate linearization curve than the ideal curve. The green line on the right shows the transmitter output that was linearized using transmitter–sensor matching
RTDs are not identical
The expected improvement in accuracy with transmitter-sensor matching is difficult to quantify. Some manufacturers state that transmitter-sensor matching can improve accuracy by up to 75%. Depending upon the RTD in question, this may or may not be true. This degree of improvement may not be consistently realized for the two following reasons:
- Accuracy will never be 100%, as there is a limited set of known test points when determining the real linearization curve for the RTD. Resistance-versus-temperature points that are not included in the testing of the RTD will not lie directly on the curve.
- RTDs operate with varying deviations from the ideal curve, begging the question: “How close to the ideal curve was the RTD in question performing prior to identifying the real linearization curve?” Even if the RTD is a Class AA, the percentage of improvement will vary, depending upon if the unit was performing at the maximum allowable deviation, or at a point closer to the ideal curve.
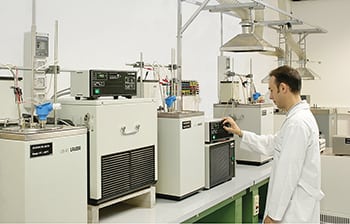
Figure 6. Many laboratories can calibrate sensors and transmitters, and determine CVD constants for an RTD and probe
A good analogy for the uniqueness of RTDs is monozygotic or identical twins. Even though identical twins are conceived at the same time from exactly the same “material,” they are still unique individuals. On the surface, twins will look and even sometimes act alike, but they still maintain traits defining them as individuals. The same is true for RTDs, even those manufactured at exactly the same time using materials from the same production run. It is important to remember that CVD constants are unique to a specific RTD. Consequently, if there is an assembly of a matched transmitter and sensor, and it becomes necessary to replace only the RTD temperature sensor, a new set of CVD constants for the RTD must be programmed into the transmitter. Should this step be overlooked or forgotten, the overall performance of the assembly will likely be worse than what would be realized by simply using the ideal curve values. If a new RTD sensor is needed, there are two basic ways to reprogram the transmitter. The first is to send the RTD sensor and transmitter to a calibration facility, where the two will be matched in a laboratory (Figure 6). Many instrument manufacturers provide such a service. The second method is to reprogram the transmitter using the CVD constants provided by the RTD manufacturer. With most “smart” transmitters, this is a relatively simple process. For example, a manufacturer may provide CVD data for input to an instrument-maintenance software program (Figure 7). An operator, maintenance technician or a service representative will then use the software and the CVD data to program a temperature transmitter with the correct information.
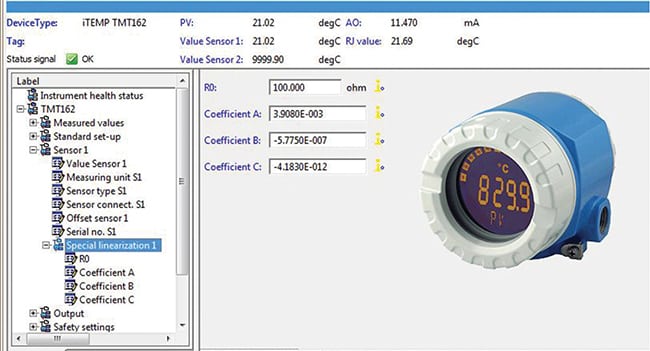
Figure 7. CVD data can be programmed into temperature transmitters using a number of commercial software programs. It is important to remember that new CVD constants must be specified when an RTD is replaced, even if the same transmitter is installed
If the plant has an extensive instrument calibration laboratory, it can determine the CVD constants, and reprogram the transmitter accordingly. The decision on how to proceed — that is, whether to use the normal IEC 60751 ideal curve or transmitter-sensor matching — is as unique as the RTD itself. Questions to ask when evaluating the best path forward include the following:
- What level of performance is required?
- What risks will be faced?
- Is there a cost-benefit concern?
For most monitoring applications, using the ideal curve and the standard Class AA, A, B or C performance expectations from IEC 60571 may be sufficient. However, for control of critical applications or processes, transmitter–sensor matching might be needed. Overall system accuracy is not simply a matter of the RTD’s measured error. It must also incorporate the performance of the transmitter as well, which is independent of the temperature sensor. Only calculating the combined effect of both components will yield realistic expectations for the accuracy of the temperature measurement. ■ Edited by Mary Page Bailey
Author
 Keith Riley is currently the national product marketing manager for Endress+Hauser (2350 Endress Place, Greenwood, IN, 46143; Website: www.us.endress.com; Email: keith.riley@us. endress.com). He is responsible for the development, marketing and application of pressure and temperature products in the U.S. Prior to this assignment, Riley served as product manager for a variety of level technologies within Endress+Hauser, as well as other manufacturers. He has a total of 20 years of instrumentation experience serving the process industries. Other interests include both functional safety and safety-by-design, with regards to the proper implementation of process instruments.