Better qualitative and quantitative understanding of the mechanisms of particle breakage at the level of the particles, the bulk material and the equipment helps minimize the risk, uncertainties and impact of particle attrition in solids processing operations
Unwanted breakage, degradation or attrition of solid particles during processing and handling is a ubiquitous issue in the chemical, polymer, pharmaceutical, food, mineral, cement, coal, mining and agricultural sectors. While the fundamental mechanisms of attrition phenomena in solids-handling processes are similar to those well researched in comminution (grinding), the varied mechanisms and unquantified state of stresses and strains in solids handling processes and equipment generate additional complexity and uncertainty.
A certain degree of attrition is inevitable during the handling and processing of bulk solids. By applying a fundamental understanding of the physics underlying particle attrition and conducting a systematic analysis of the attrition processes, the negative consequences of attrition can be minimized and mitigated. A two-pronged approach of particle engineering and process engineering must be taken to find the optimal solution. Using the systematic method discussed in this article, the sources of attrition can be identified and mitigated.
Consequences of attrition
In almost all processes involving granules or granular fluid flow, product attrition is a challenge. Among the industry sectors that continue to address attrition are the following: coal, chemicals, petrochemical catalysts, agriculture, cement, detergents, plastics, food, pharmaceuticals and others.
Potential negative impacts resulting from the attrition of solid materials in processes include the following:
• Loss of product due to fines generation — especially when fines cannot be recycled, or the cost of recycling fines is high
• Reduced value due to inferior finish (for example, in food or polymers)
• Loss of activity or functionality (for example, in sorbents, catalysts or seeds and grains)
• Processing problems caused by increased fines (such as segregation, bridging, clogging, feeding, dusting)
• Alterations in end-use applications (for example, fines in polymers, active pharmaceutical ingredient effectiveness in pharmaceuticals, dissolution rates for chemicals)
• Environmental issues (for example, neighborhood impact on process emissions due to fugitive dust)
• Safety hazards of fines, including higher combustibility, explosivity and reactivity, as well as industrial health issues (inhalable dust emissions during processing and end-use)
In most cases, attrition is unintentional and undesirable. Engineers strive to minimize it and its consequences during process design and operation. Attritability (or friability), which refers to the tendency of the particles to break during processing and handling, is not a fundamental property of a material. It is a cumulative (and iterative) consequence of material properties, as well as specific unit-operation and processing conditions (Figure 1). Broad generalizations should not be made about equipment, operating conditions or product families without systematic studies or an attrition audit. Such studies on large-scale equipment and processes are expensive to conduct, and often are not feasible at the design stage.
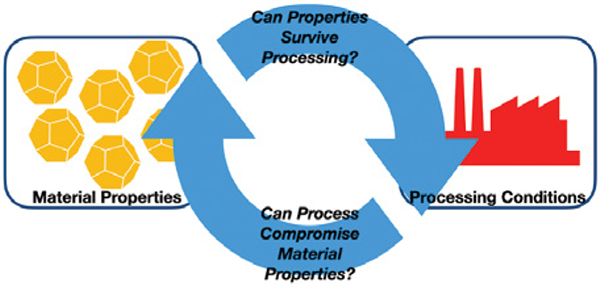
FIGURE 1. The graphic conceptualizes the assessment of material and processing conditions for attrition potential
As with all engineering problems, approaches based on the scientific method (hypothesis generation, testing and validation) are the most efficient and robust. Various tools, such as fishbone plots, affinity plots and “five whys,” along with software for statistical analysis, can be used.
To minimize the uncertainties, risks, and impact of attrition on process design, it is imperative to understand (qualitatively and quantitively) the fundamental mechanisms of breakage at the particle, bulk and equipment levels. The selection of a suitable test method at the particle or bulk level requires an understanding of the mechanisms governing attrition in any unit operation. The challenging part is the quantification of mechanical stresses and corresponding frequencies during process residence time. Therefore, for each unit operation in a process, one must delineate the dominant “bulk mechanisms” for particle breakage, their corresponding impact on the type of particle breakage (fragmentation, surface abrasion, chipping, crumbling), and the consequent impact on bulk properties (bulk density, flowability, fines content), which can affect the process step or end use of the product. A holistic view of the process and product engineering is the key to minimizing the deleterious effects of breakage and attrition.
Attrition mechanisms
Attrition occurs when particles in motion come into contact with other particles, or the rigid wall of a vessel or pipe, and the dissipated energy triggers mechanisms for particle breakage. The underlying mechanisms of crack formation, growth and propagation are similar to those observed during comminution or grinding. Much like comminution (grinding or size reduction), attrition is statistical in nature. Not all particles are identical, and neither are the contact or collisions events. One must rely on the measurement of average values or use appropriate statistical functions (such as the Weibull distribution) to quantify it.
As with any solid, failure will occur when stresses exceed the strength of the section to which they are applied. Sharp corners and local aspirates of the small cross-section are vulnerable to modest impact and shear forces that cause an abrasive form of attrition. This vulnerability results in the particles attaining a more rounded form without a significant change of overall particle size, with a degree of fines being created from the broken fragments. More radical fracture of the body of a particle tends to generate a broader range of reduced-size, sharp-edged particles. Attrition is minimized by reducing applied stresses.
Mechanisms at the particle level. The failure modes for a particle can be categorized as brittle, semi-brittle and ductile. The propensity of a particle to fail in a certain mode depends on material properties, strain rate, elastic/plastic state of stress, particle size and contact geometry.
When a particle is subject to external stress (normal or tangential), and the peak stress does not exceed the plastic yield stress (onset of yield), the reversible deformation is considered elastic. Otherwise, the deformation is not reversible, resulting in viscous flow (that is, a dent) or damage to the particle. Any damage to the particle will first be due to brittle failure, resulting from defects, imperfections, microcracks and surface flaws. Brittle failures at high strain rates usually result in cracks that split the particle into fragments. Particles do not fail in a predictable or consistent way because the size and position of the flaws within the particle are varied. The Weibull distribution is commonly used for interpreting fracture data due to brittle failure.
When the impact stress exceeds the onset of yield, plastic flow occurs with viscous energy dissipation. Yet, plastic flow can also generate cracks and microcracks along with compressive radial, normal and tensile stresses during loading and unloading cycles. Radial and normal stress cracks could result in fragmentation, while the lateral stress cracks form chips.
This type of ductile failure can be observed in soft materials where plastic flow ends with a rupture. Plastic flow serves as the precursor to ductile failure. Shear yield stress of the material at the contact via shear chains will determine the extent of damage (ploughing, smearing or cutting). It is known that an oblique angle of attack and shear stress at contact cause damage in ductile materials.
It should be noted that the mode of failure or breakage is not wholly inherent to the property of the material. The strain rate, particle size and shape can change the failure mode. For instance, large particles can fail in brittle mode due to the presence of internal cracks and flaws, along with contact geometry. The fines fraction of the same material can fail in ductile mode due to the absence of flaws and contact geometry. Similarly, high-strain-rate impacts can cause brittle failures, whereas low-strain-rate crushing could result in semi-brittle or ductile failures.
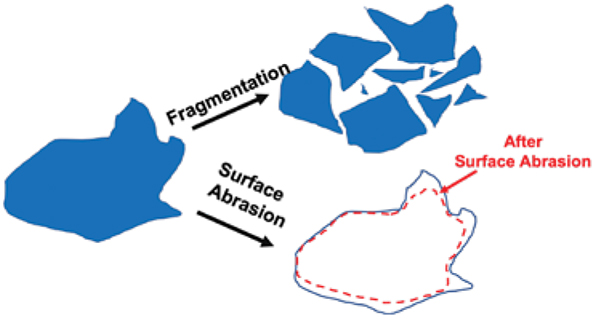
FIGURE 2. The primary mechanisms of particle attrition are fragmentation and surface abrasion
Particle attrition during handling and processing is not a singular phenomenon. The mechanism of particle breakage is broadly categorized as follows: fragmentation/fracture, leading to large sub-fractions; and surface abrasion (chipping), leading to fines (Figure 2). While the breakage manifests itself either as a shift in the peak (the parent peak) of the particle-size distribution or the formation of a new peak in the small particle-size range (daughter peak), a closer examination of the particles before and after the handling event can lead to a deeper understanding of the attrition mechanism (Figure 3). Such analysis is necessary to delineate the underlying mechanisms, identify test methods to quantify them, and design and select suitable equipment and operating conditions to mitigate them.
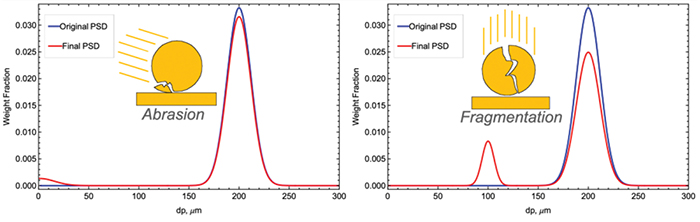
FIGURE 3. Different attrition mechanisms for solid particles show different effects in analyses of particle size distribution
Fragmentation/fracture can occur instantaneously due to the presence of internal or external flaws under subjected stress conditions and loading rates. Multiple repeated impacts (cyclic loading) can cause defects, dislocations or failure planes within the particle, which can subsequently fail due to fatigue. Fragmentation leads to smaller particles of different sizes and shapes that may not resemble the original particle. These smaller fragments may have sharp corners which are then more prone to surface abrasion and chipping.
Fines generated by breakage of asperities due to high compressive stresses, low repetitive tangential stress, and high shear stress at lateral cracks or sharp edges are collectively considered surface abrasion. The overall particle-size distribution largely remains unchanged, except for the formation of a new fines fraction and an increase in particle “roundness” (reduction of edges and asperities).
These two mechanisms mainly occur simultaneously in a system. The relative extent of each mechanism depends on material properties and process conditions. The threshold energy, stress or velocity required to cause fragmentation/fracture is higher than abrasion. As shown in Figure 4, abrasion will occur without fragmentation at low impact velocities, whereas fragmentation will be the dominant mechanism at higher velocities.
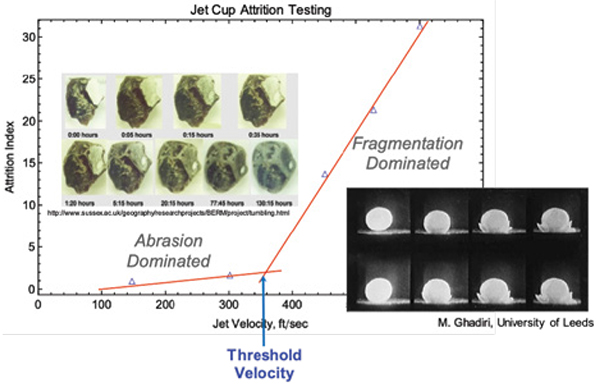
FIGURE 4. The graphs illustrates the concept of threshold velocity. At lower jet velocities, abrasion is more common, while at higher jet velocities, fragmentation dominates
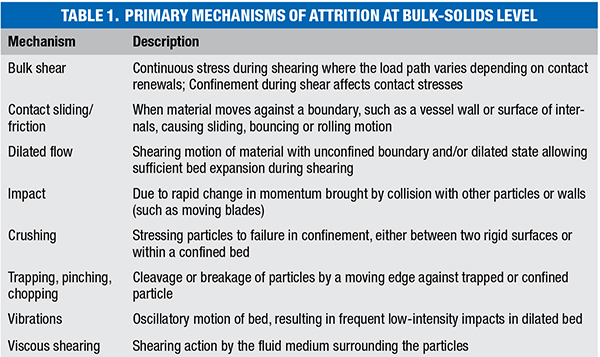
Mechanisms at bulk-solids level. Treating the behavior of particles as an ensemble (or bulk) is a practical approach toward developing a mechanistic view of the process. These mechanisms are quantifiable and more amenable to modeling with continuum modeling using average properties. The primary attrition mechanisms at the bulk level are summarized in Table 1.
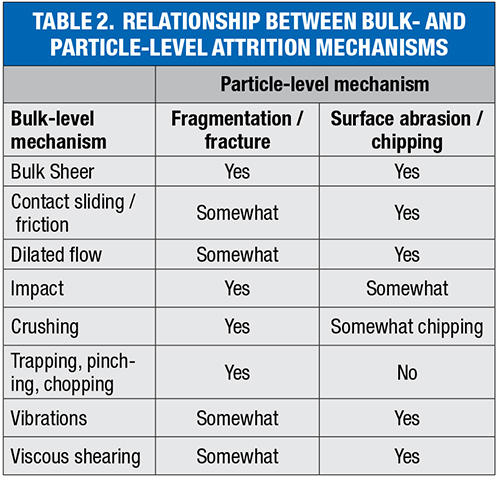
While the bulk-solids-level mechanisms are well understood for various unit operations, the particle degradation or breakage still occurs at the particle level. Therefore, a fundamental understanding of attrition behavior still requires developing the linkage between bulk-level and particle-level mechanisms. A general guidance for the relationship between bulk- and particle-level mechanisms is shown in Table 2.
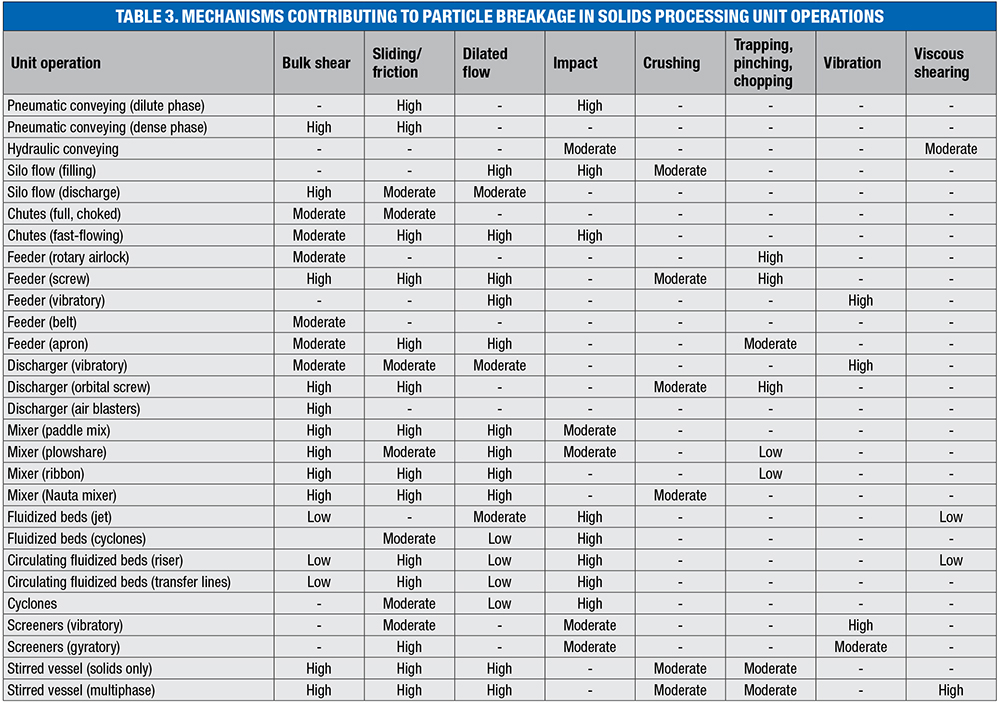
Mechanisms at unit operation (equipment) level. Table 3 is an attempt to summarize the contributing mechanisms for particle breakage for key unit operations. The relative impact of these mechanisms on overall breakage will depend on specific material properties and operating conditions. Since typical processes have multiple unit operations, the impact of attrition on all downstream unit operations, and upstream equipment influenced by recycle loops, must be considered.
Attrition testers
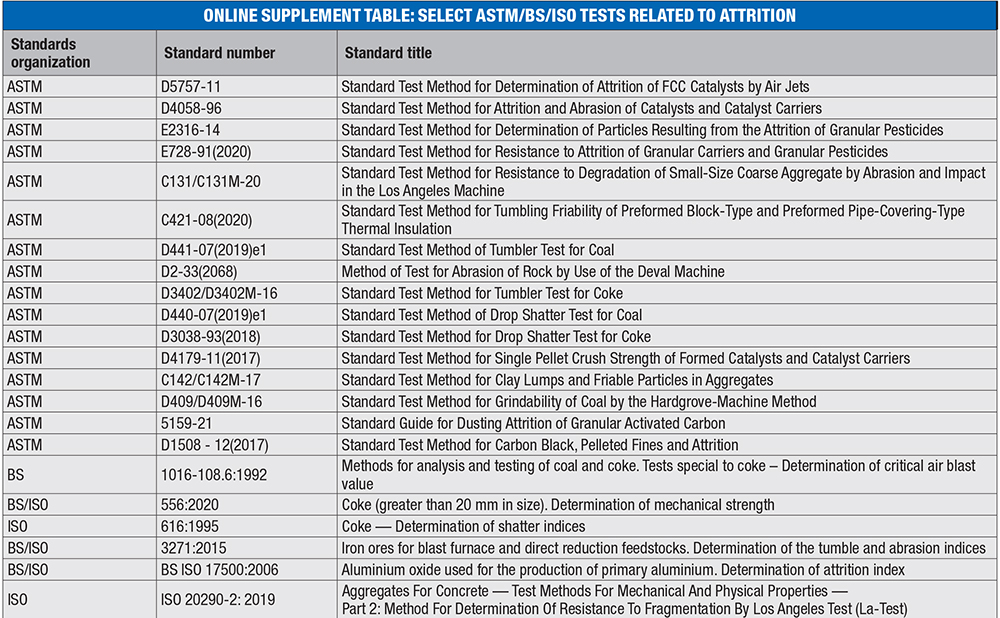
An excellent survey of attrition tests can be found in the attrition guide by BMHB [1] and in Bemrose and Bridgewater [2]. Various standard tests have been documented in ASTM/BS/ISO standards (they are listed in an online supplement at the end of this article). The list of standards is indicative of the fact that various industries have developed relevant tests to quantify attrition and rank materials for their propensity for breakage (friability).
These tests can be classified as single-particle tests or multi-particle tests (bulk materials). The single-particle tests are suitable for coarser particles (larger than ~300µm) and measure the integrity of particles through various impact and crushing mechanisms (ASTM D4179). These tests replicate the fragmentation mechanism. For instance, these tests can be useful to compare the strength of coarse particles (such as catalyst pellets) to understand breakage or attrition in packed beds.
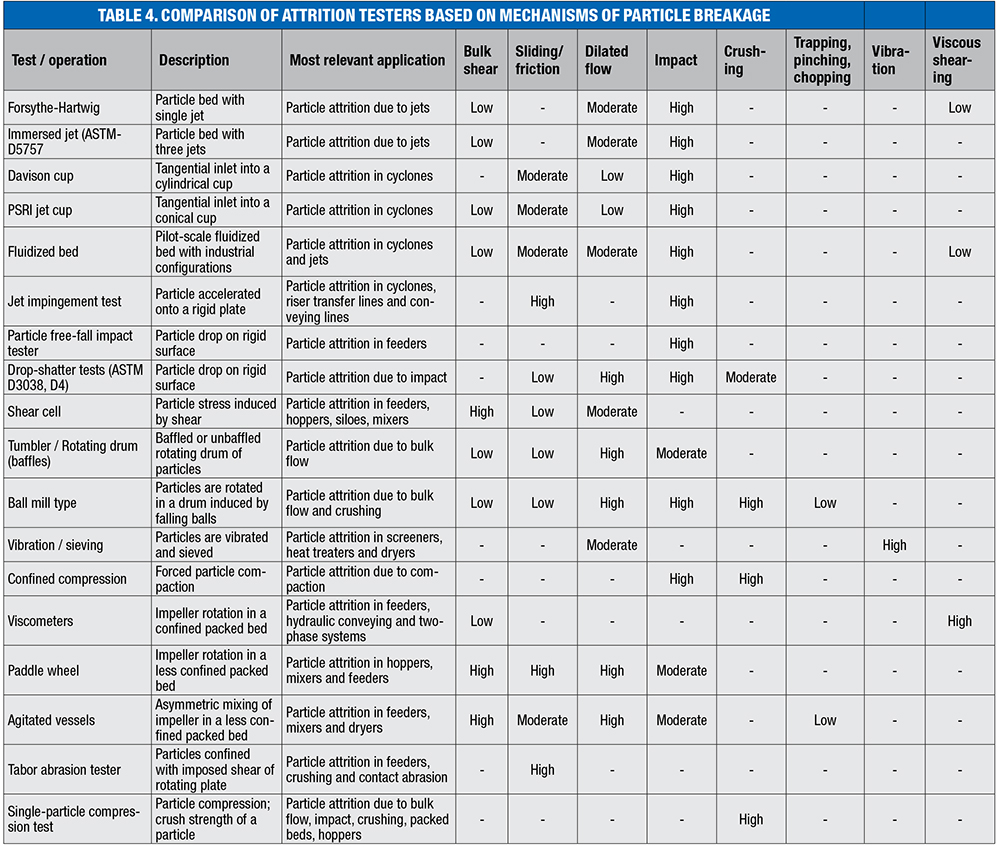
Multi-particle or bulk tests are commonly used to compare materials or estimate the extent of fines generation in the process. Commonly used attrition testers [1,2] are shown in Table 4.
These testers are typically used for either (i) comparing different materials and their behavior (process function) in a given unit operation (same mechanism, different products) or (ii) comparing different processes to compare attrition rates (different mechanisms at play).
It has been demonstrated in the literature that the relative rankings depend on the specific tester and the testing conditions. Therefore, careful selection of tester and the operating conditions that represent the process of interest is critical for making useful evaluations and comparisons.
Each tester replicates a set of attrition mechanisms and relevant process functions under controlled conditions. Therefore, it is critical to match the tester with the inherent mechanism to the process dynamics in question. For example, an impact-based attrition tester is more relevant for dilute-phase pneumatic conveying, whereas a shear cell is more suitable for dense-phase. Thus, before applying any test method, the following items need to be considered:
1. Match key contributing mechanisms between tester and process
2. Choose an appropriate range of operating conditions that match the process conditions. For accelerated tests, make sure that the fundamental mechanism of particle breakage remains the same
3. Agree on the definition of relevant attrition index based on process requirements
Consider the effects of temperature, humidity and fluid properties (such as viscosity and density) on the mode of attrition. For example, certain polymers can fail in brittle mode at room temperatures while in ductile mode at operating temperatures. Similarly, humidity or moisture can affect the strength and ductility of formulated extrudes.
It is important to condition the sample to replicate its condition in the process at steady-state operations. For example, the attrition characteristics of new fluid catalytic cracking (FCC) catalyst can be 5–10 times worse than the equilibrium catalyst (e-Cat).
Quantifying attrition
Particle breakage is generally quantified by comparing the particle size distribution before and after the handling operation. The fraction of particles below a critical particle size can be compared with the original distribution. The definition of critical particle size depends on the unit operation. For fluidized beds, a 20- or 44-µm cutoff is common. This metric is generally only applicable for Geldart Group A powders. For larger particles, the definition of fines will have to be reconsidered. In coke applications (ASTM D4058), particles less than 850µm are considered fines. Alternately, the ratio of median particle sizes (d50) can be used for comparison. Attrition index is expressed by the following relationship:
Attrition Index (AI) = (%fines < xµm at start – %fines < xµm after y hours) / (%fines < xµm at start)
Critical particle size (xµm) and test duration (y hours) are application- and material-specific.
Alternately, AI can be defined as the ratio of median particle sizes when fragmentation mechanism is the dominant one.
AI = d50,initial /d50,final
When considering large particles, attrition indexes based on the generation of fine particles below 20 or 44 μm are insufficient to describe particle breakage mechanisms. Figure 5 shows the particle size distributions (PSD) of the typical attrition test. The red and black curves correspond respectively to the initial and the final particle size distributions. The blue curve corresponds to the difference between the initial and the final particle size distribution. The positive area delimited by the differential blue curve corresponds to the amount of particles generated by attrition, while the negative area corresponds to the amount of particles that were attrited. A new index developed by IFPEN [4] is based on the total percentage of particles generated by attrition, which corresponds to the positive area delimited by the differential blue curve shown with the green lines. This index is referred to as the TFGI (total fines generated index) and is shown in this equation:
TFGI = Mgenerated /Minitial × 100
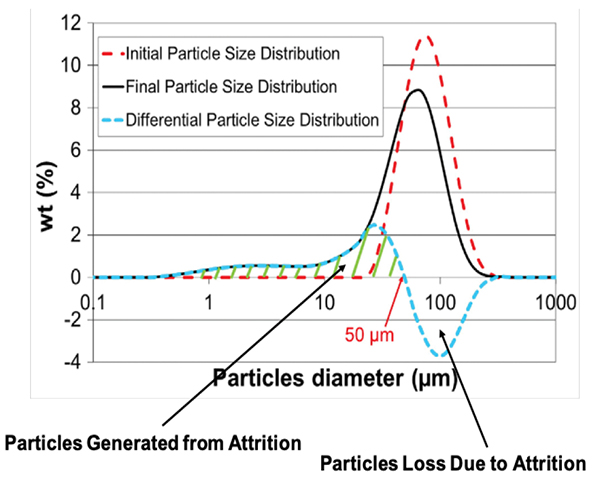
FIGURE 5. The graph depicts the total fines generated index (TFGI), which establishes the relationship between particles generated by attrition to those lost to attrition
To obtain reliable particle-size distribution analysis, it is important to obtain a representative sample by following good sampling practices, and select a measurement method that does not cause additional particle breakage during measurement (such as sieving)
When the particles primarily attrit through surface abrasion, particle-size distribution shifts can fall within the band of errors due to sampling and analytical measurement. In such cases, microscopic examination for changes in shape (roundness, edge removal) and qualitative loss of shine may serve as the metrics. However, quantitative measures of shape (shape factors) must be carefully selected with a rational basis. Not all shape factors are equally sensitive to the change in the shape feature of interest.
It is uncommon to use bulk properties, such as bulk density, tap density, shear strength, coefficient of wall friction, for quantifying attrition. However, properties of interest to the end-user should be the final arbitrator. For instance, in grain handling, the fraction of seeds that fail to germinate due to damage during handling is more important than the amount of fines generated. Whatever metric is used, it needs to be applied in the same context, since these metrics are broadly defined in general.
Identifying attrition sources
A systematic approach to understanding and mitigating attrition — which involves looking at particle and bulk behaviors, identifying factors responsible for attrition and developing a hypothesis for action — can solve many attrition-related problems in solids handling processes. The steps needed for this approach are outlined below and diagrammed in Figure 6.
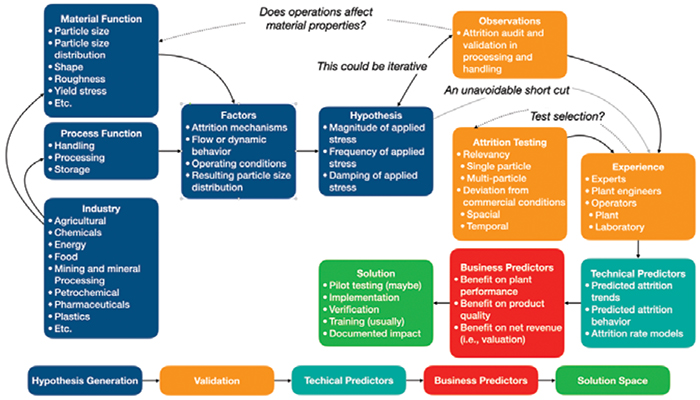
FIGURE 6. The diagram shows a holistic view of the work process involved in understanding and mitigating
particle attrition problems
Step 1. Identify key variables in material and process functions. Friability of a material is not a fundamental or state property of the material. That is to say, the path to attrition matters. The potential for, and extent of, breakage during handling and processing can best be understood by analyzing the material function and the process function. Our inability to quantitatively predict breakage from first principles is due to the large number of variables involved and our inability to quantify them within the volume — both temporally and spatially. Often, average values are helpful for empirical correlations, which then require experimental validation or calibration. Key material properties include the following:
• Particle size
• Particle size distribution
• Particle shape
• Density (skeletal and envelope)
• Porosity
• Surface texture or roughness or asperities
• Hardness (crush strength)
• Fracture toughness
• Elasticity/plasticity (brittle/semi-brittle/ductile)
• Young’s modulus
• Poisson ratio
• Cracks, microcracks and internal flaws, surface flaws
• Thermal stability
• Chemical stability
• Imaging of particles
Some of these properties are easy to obtain, but others are more difficult. Prioritization is critical with these difficult-to-obtain properties, and needs to relate to the process function. For example, particle size and distribution may be lesser factors for a downward-flowing, inert packed bed than porosity and hardness. On the other hand, particle size and distribution, friability and roughness are more critical in a fluidized bed than hardness. In almost every case, imaging of the material before and after is paramount. Seeing the aftermath of the particle interactions can indicate the mode and sometimes the source of attrition. Key process properties include the following:
1. Particle-particle contact stresses and distribution
2. Internal stresses within particle due to thermal history or chemical exposure
3. Particle-wall stresses and stress distribution
4. Impact angle between particle and walls
5. Residence time distribution
6. Strain rate (impact versus crushing): particle velocity, velocity gradients and deformation rates of a particle during contacts
7. Confinement during shear and dilation
8. Temperature and temperature gradients (temporal and spatial variations)
9. Wall roughness
10. Ductility or compliance of wall material (vessels, pipes and blades)
11. Particle dispersion (packed bed to dilute suspension)
The system configuration, operating conditions and particle dynamics within a process are responsible for contact stresses, strain rates and failure modes of particles.
Step 2. Rank the factors. The list of potential factors (properties) can be extensive. It is not practical or necessary to measure all the properties to move forward. To narrow down the list to only relevant factors, one must draw upon process knowledge and plant observations. For instance, microscopy or visual dustiness indicates the dominance of an abrasion mechanism, which can be further corroborated by analysis of particle size distribution. Similarly, asperities on the particle are being removed in the processing, which tends to be a lower-kinetic-energy process. If a daughter peak is seen in the particle size distribution, fragmentation is possible, which is a higher-energy process. For fragmentation, the sources of attrition are more limited than for abrasion. If fragmentation appears to not yet be happening, and the level of shear in the process does not seem significant, then perhaps the crush strength could be revealing. One should let the process fundamentals and observations guide the ranking of factors.
Step 3. Generate hypothesis. A hypothesis can be developed with measured material and process properties, and an understanding of the factors that could be responsible for attrition. This is usually an iterative process. Brainstorming tools can be helpful here. There is still guessing at this point, but it is more educated. From the factor exercise in Step 1, one has an idea of the magnitude and frequency of the stress needed. Where would such stresses be in the process, keeping in mind that such stresses are not being dampened? Particles tend to dampen stresses in a flowing system. In regions of dense, slow-moving particles, stresses are dissipated. In regions of dilute, faster-moving particles, a direct and localized impact is likely. Therefore, first look for a source of attrition in the dilute regions for flowing systems.
In non-flowing or slow-moving systems, this is not straightforward. Normal stresses become a factor. That is why the measurement of crush strength is more important for such systems. Crush strengths less than 25 psi suggest that the particle may be too weak for a large packed bed.
The hypothesis needs to focus on the path to attrition and not on the unit operation itself. For example, if the particle-size distribution of the attrited material shows a daughter peak, and imaging shows particles that have been fractured into various fractions, then the hypothesis would be that the attrition is due to a high-kinetic-energy event, such as high-velocity jets, or crushing due to a rotary valve or screw feeder.
Step 4. Validate with observations, experience and testing. The hypothesis provides an idea of what to look for in an attrition audit. Each step of the process should be examined to find regions where the source of attrition is in line with the hypothesis for the cause of the attrition (observations). One would be looking for regions of high shear that could be causing fragmentation, such as a gas jet, screw feeder or paddle mixer where the flight clearances are comparable to the mean particle size or are spinning too fast; a dilute-phase conveying line with abrupt elbows (or too many elbows); or a primary cyclone with a high inlet velocity. Once the potential source(s) of attrition has (have) been identified, it needs to be validated. Consulting experts, plant engineers and operators can validate the source of attrition once identified.
More often than not, attrition problems are not unique. Chances are high that experts have encountered and solved similar problems, and plant engineers, operators or quality-control-laboratory technicians may have suspected the cause of an attrition problem already. These are resources that should be utilized to discuss the hypothesis and observations (experience). Is it in agreement with historical evidence? Do those closest to the problem see the logic in the hypothesis? Was something missed? All of this and more need to be discussed in a group setting.
Even with all parties in agreement, it is value-added to do some local testing to validate the agreed-upon hypothesis (testing). There is a plethora of attrition testing and few standards. Thus, the selection of the attrition test method must be relevant to the hypothesis. Is the velocity or impact used in the testing comparable to plant operations? Can this be done under ambient conditions, or does it need to be done at high temperatures or in a special environment? Is fatigue a factor (suggesting that testing needs to look more at equilibrium conditions than initial conditions)? These questions and more need to be asked and addressed, endeavors typically best done by consulting experts.
Attrition testing further confirms the hypothesis and observations. These test results, coupled with team experience, can narrow down possible causes and provide a path toward solution(s). However, it is critical that attrition testing is representative of the hypothesis. There is a wide range of attrition test methods, and permutations within the methods themselves, so the choice of the attrition test is possibly the most important decision in this work process.
Step 5. Develop technical predictors. Based on the laboratory results and re-evaluations of the hypothesis and re-discussions with your experience team, predictors need to be developed. Predictors are tools that describe attrition trends or behaviors or a mathematical expression to describe the hypothesis. For some processes, a simple trend map is all that is needed. For other processes, a detailed mathematical model is needed. For example, consider a process that has experienced high solids losses due to attrition, and the hypothesis is that the new feedstock from a different vendor may be the issue. Attrition testing confirms that, under the representative testing, the new material is more friable than the older feedstock. Microscopy suggests that the new feedstock is rougher than the old feedstock. The proposed solution may be to not use the new vendor, or to add additional collectors to capture the solids in the process. Economics will decide which is more cost-effective, leading to the Step 6.
Step 6. Develop business predictors. Before a solution is implemented, business drivers need to be developed. These are typically predictors (models, tools) that quantify benefits to the plant in terms of performance, product quality and valuation. Business drivers are quantifiable metrics on what the improvements to the plant will deliver. For example, benefits could include ten months longer reliability for downstream equipment, or a 25% decrease in fines contamination, resulting in an increase in net revenue by 3%. We now have the information to determine the net present value (NPV) or internal rate of return (IRR) for the proposed modifications to mitigate the attrition issue. If it exceeds the business criteria of the company, then the solution should be implemented, assuming there are no barriers that make it an issue.
Business drivers allow engineers to decide if the solution is value-added. That information will be useful when they need to present a business case. It will also provide the data needed to see if the solution delivers as promised. A technical solution without appropriate business drivers is unlikely to be implemented.
Step 7. Implement solutions. After the hypothesis appears to be valid, as confirmed by testing, experience team and predictors, specific measures to mitigate or eliminate attrition must be proposed. These could include changes in operating discipline, minor changes in existing hardware, replacement of specific unit operations or a totally new process flowsheet. While changes in operating discipline can be easily implemented and tested in the plant, changes related to hardware will require representative pilot-scale testing, which is typically done in collaboration with the equipment vendor. Such testing provides further verification of the drivers and may reduce downtime.
The technical package should consider performance at steady state (lined out) conditions, as well as the effects of upsets and offsets, and should guide recovery with minimal consequences. The comparison of technical options should include capital required, ease of implementation, technical maturity, operability, maintenance, energy and CO2 footprint, waste and yield. The authors have observed that the complexity and risks of retrofit projects are often under-appreciated.
Even after the solution is implemented and early measurements suggest it is working, the process is not finished. Training may be needed for new equipment or changes with existing equipment. Plant personnel may need training on new work processes. Training is the secret to maintaining all the gains from this work process. Also, documenting how the solutions compare to the business drivers, and noting any lessons learned, is helpful. In order to sustain the gains of the solution(s), it is imperative that a control plan be developed to track and validate the gains.
New processes
All too often, plants involving granular materials are not designed for granular material, including designing with attrition in mind. Designing a new plant where attrition can be a problem is no different from fixing an existing plant with an attrition problem. Instead of finding the source of attrition, one need to target potential sources of attrition and either mitigate or reduce the possible source or engineering around the operation. An example of a new fluidized-bed process illustrates the point.
Fluidized beds are known to have attrition sources associated with the distributors and the cyclones. With access to the material function (properties) and the operating conditions, experts can determine the gas jet velocities, jet penetration length, and cyclone inlet velocity. From jet cup attrition testing, if the catalyst begins to fragment at a threshold velocity of 120 ft/s, then the catalyst is friable and needs to be handled delicately.
First, gas jets can be tempered using shrouds around the jets. Shrouds lower the gas velocity as it penetrates the bed and reduces the number of particles entrained in the gas jet. PSRI has studied the effectiveness of shrouds in fluidized beds and found that a well-designed shroud can reduce attrition by more than four times.
Second is to reduce the gas-inlet velocity in the primary cyclone. Collection efficiency could be compromised, but you can increase the inlet or, better yet, the outlet velocity in the secondary cyclone. Attrition in the secondary cyclone could be high, but less than 5% of the material in the operation is going to the secondary cyclone, so overall attrition is still significantly reduced. If the solids loading is too high for one secondary cyclone because of the reduced efficiency in the primary cyclone, add a second secondary cyclone in parallel.
Edited by Scott Jenkins
References
1. Particle Attrition (State-of-the-Art-Review), British Material Handling Board (BMHB), Trans Tech Publications, Vol. 5, 1987.
2. Bemrose, C.R. and Bridgewater, J. A Review of Attrition and Attrition Test Methods, Powder Technology, Vol. 49, pp. 97–126, 1987.
3. User Guide to Particle Attrition in Material Handling Equipment, Pub: British Material Handling Board. www.bmhb.co.uk.
4. Amblard, B., Bertholin, S., Bobin, C. and Gauthier, T. Development of an attrition evaluation method using a jet cup rig, Powder Technology, vol. 274, pp. 455–465. 2015. doi:10.1016/j.powtec.2015.01.001.
Authors
 Shrikant V. Dhodapkar is an R&D Fellow in the Dow Plastics Process R&D Organization at The Dow Chemical Company, (Lake Jackson, TX, 77566; Phone: 979-238- 7940; Email: sdhodapkar@dow.com) and a Fellow of the American Institute of Chemical Engineers. Dhodapkar holds a Bachelor of Technology (B.Tech.) degree in chemical engineering from the Indian Institute of Technology, New Delhi (India) and earned M.S. and Ph.D. degrees in chemical engineering from the University of Pittsburgh. During the past 30 years, he has published prolifically on various aspects of solids processing and contributed chapters to several handbooks, including the 9th edition of Perry’s Chemical Engineering Handbook. He has extensive industrial experience in designing and troubleshooting solids processing plants, and process development and implementation of technologies related to polymer production. He is the past chair of AIChE’s Particle Technology Forum and past member of Chemical Technology Operating Council.
 Jörg Theuerkauf is a R&D fellow in the Engineering and Process Sciences, Core R&D Organization at The Dow Chemical Co. (Midland, MI, 48667; Phone: 989-638-5033; Email: jtheuerkauf@dow.com). Theurkauf holds a Diplom Ingenieur (M.S.) and a Ph.D. in Mechanical Engineering from the Technical University of Braunschweig, Germany. Over the last 20 years, Theuerkauf has been developing products and processes for Dow and worked on global trouble shooting projects. During this time he has worked on many solids processing related projects including designing processes for optimized particle designs used in the food and pharmaceutical industry. Besides solids handling he is working in the area of fluid mechanics and mixing.
 Ray Cocco is the president and CEO of Particulate Solid Research, Inc. (PSRI; 4201 West 36th Street, Chicago, IL 60632; Email: ray.cocco@psri.org; Website: www.psri.org), a research company of member companies from all over the world. He has over 30 years of experience in reactor engineering, modeling, fluidization, and particle technology. He has worked on ceramic processing, oxydehydrogenation, catalytic oxidation, hydrogenation, hydrodesulfurization, composite materials, biomass, chemical looping, polyolefin, chlorination, and oxychlorination. He is an advisory board member of the University of Florida Chemical Engineering, Auburn University Chemical Engineering, University College at London’s CNIE. Cocco was the past chair of the AIChE Particle Technology Forum (Group 3), a past member of the AIChE Chemical Technology Operating Council (CTOC), and is currently an AIChE Fellow. He has over 80 publications, three book chapters, several patents, numerous invited presentations, and regularly consults for industry, national laboratories and universities.