Modern control systems for chemical processes can generate frequent alarms. This one-page reference provides information on common alarm-management metrics, which can foster focused remedial actions and ultimately lead to a safer, better-performing plant.
Alarm frequency
As alarm frequency increases, an operator’s ability to respond correctly and in time to avoid the ultimate consequence of inaction decreases. If the rate is excessively high, some alarms will likely be missed altogether or be ignored by the operators. Alarm rates that exceed thousands per day are common in the chemical process industries (CPI), a level that is far greater than humans can handle successfully.
Response to alarm rates of 10 alarms per 10 minutes can possibly be achieved for short periods of time — but only if the alarms are simple ones. And this does not mean such a rate can be sustained for many 10-minute periods in a row. An alarm flood can be defined as a 10-minute period with more than 10 new alarms, continuing through subsequent 10-minute intervals until reaching a 10-minute interval with fewer than five new alarms.
The peak number of alarms within a 10-minute period is a straightforward measure of the degree of difficulty of the worst-case alarm flood for the operator. In poorly performing alarm systems, it is common to see peak alarm counts in a 10-minute period that exceed 250. During flood periods, operators are likely to miss important alarms.
Average alarm rate
Average alarm rate is a straightforward measure of the frequency with which new alarms are presented to the operator, expressed as an average count per day, per hour or per 10-minute interval. Averages can be misleading, however, because they provide no sense of the peaks in the alarm rate, making it difficult to distinguish alarm floods from steady-state “normal” operation. Consequently, it becomes valuable to supplement this basic value with a timeline view or separate calculation of alarm rates for both the times when operation is normal and for times of an alarm flood.
An example of the timeline view is shown in Figure 1. If the overall average alarm rate (16.5 alarms/h in the example) is lower than the action limit of 18/h, it may not appear to be a point of immediate concern. However, the timeline view shows that there are significant periods of time where the performance is unacceptable.
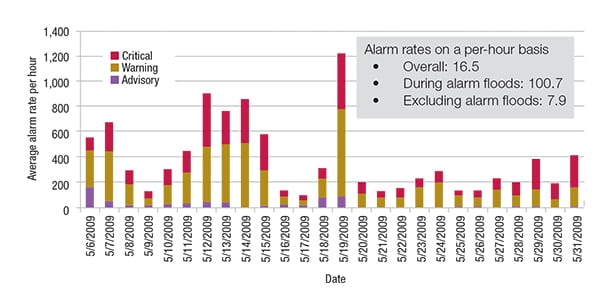
Figure 1. Timeline views of the data can reveal periods where alarm performance is not acceptable
Two metrics — the percentage of 10-minute periods with more than 10 alarms, and the percentage of time spent in an “alarm flood” state — are often used to help quantify how much of an operator’s time is spent within the situation where more alarms occur than can be managed effectively. Pie charts like the one in Figure 2 illustrate how much time is spent within certain alarm-rate ranges.
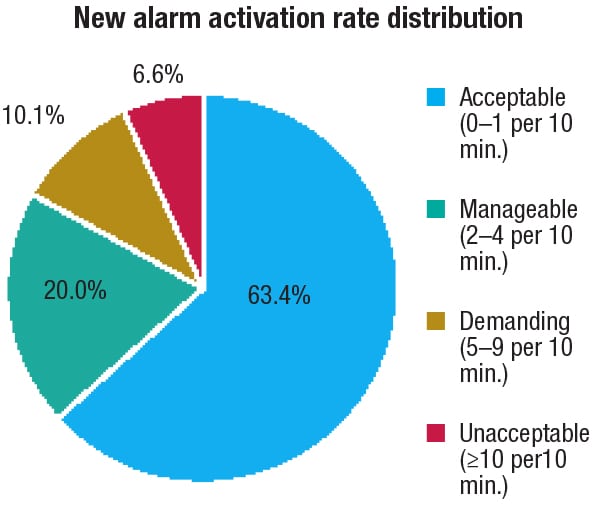
Figure 2. Pie charts can give information on how much time is spent in the acceptable range
Causes of high alarm rates
Common contributors to excessively high alarm rates include the following:
- The alarm system is used to notify the operator of events that do not constitute actual alarms, such as communicating informational messages, reminders or alerts, rather than an equipment malfunction or process deviation
- Chattering or frequently occurring nuisance alarms are present. These often originate from non-process alarm sources of marginal interest. Chattering alarms can also indicate an incorrect alarm limit or deadband
- Redundant alarms, where multiple alarms occur for a single abnormal situation. For example, when a pump is shut down unexpectedly, it can generate a pump fail alarm in addition to alarms for low outlet flow and discharge pressure
- A problem with the metric calculation is occurring. A correct calculation only counts new alarms presented to the particular operator or operating position for which the metric is intended
- Cascading alarms happen when sudden equipment shutdowns trigger automated actions of the control system, which in turn, triggers more alarms
- When routine transitions between process states occur, the alarm system can therefore falsely indicate abnormal conditions
References
1. VanCamp, K., Alarm Management By the Numbers, Chem. Eng., March 2016, pp. 50–55.
2.Hollifield, B., Understand and Cure High Alarm Rates, Chem. Eng., March 2016, pp. 56–60.