This practical guide provides information on proven backwash-tuning techniques that will improve the reliability and robustness of sand filters in water treatment applications
Water is a fundamental part of virtually all plants in the chemical process industries (CPI). Examples of water usage include the following: makeup water for an open, recirculating cooling-water system; boiler feedwater for steam production; firewater; and others. Raw water must be treated or clarified before being used as makeup water in most utility processes. Clarification and filtration remove suspended and partially dissolved solids, bacteria and other forms of impurities to help prevent system scale, corrosion, and fouling.
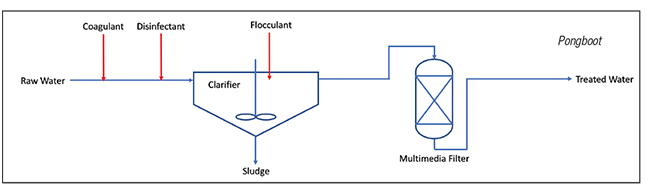
Figure 1. The diagram shows a simplified raw-water treatment process, with clarification plus filtration
A simplified flow diagram of a typical raw-water treatment plant is illustrated in Figure 1. Clarification takes place in three sequential steps, described here:
Coagulation. Coagulants (such as inorganic salts of aluminum or iron) are usually added to initiate coagulation. Because coagulation prefers high shear and rapid mixing, coagulants are generally injected into the feed line upstream of a static mixer.
Flocculation. Flocculants (high-molecular-weight, water-soluble organic polymers) are typically added to enhance small particles’ agglomeration into larger particles. Flocculation ideally takes place in an environment with low shear, high retention time, and moderate mixing. Typically, flocculants are directly injected into a mixing zone of a clarifier.
Sedimentation. Sedimentation is the physical removal of agglomerated particles from suspension or settling, usually under low water velocity in a clarifier’s settling zone.
In addition to coagulants and flocculants, disinfectants (such as sodium hypochlorite; NaOCl) are also applied to suppress microbial growth. On rare occasions, pH adjusters, such as sodium hydroxide, can also be used for neutralization.
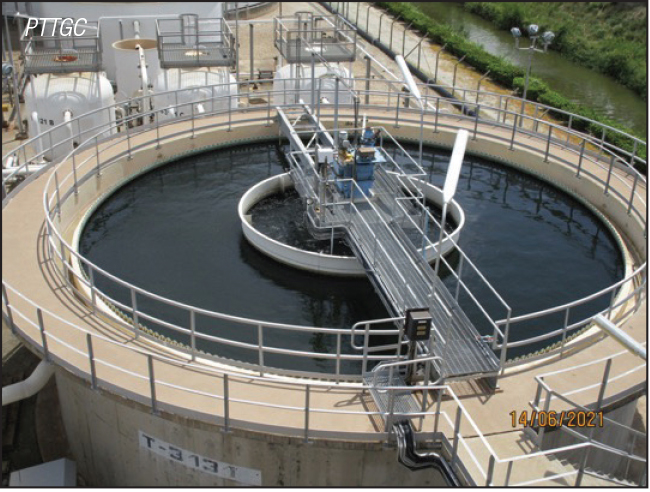
Figure 2. In a sludge blanket clarifier, such as the one shown here, good sludge-blanket control is a crucial part of a successful operation. A periodic visual check for sludge level is essential, since there is no sludge level sensor available
Multiple types of clarifiers are available in the industry. A sludge blanket clarifier is one example (Figure 2). In most raw water clarification, a portion of the clarified water is filtered with the aid of a sludge blanket in the settling zone. Clarifier effluents of 2–10 nephelometric turbidity units (NTU) may be improved to 0.1–1.0 NTU by conventional sand filtration.
Generally, raw-water clarification is a highly manual process and often requires intensive human monitoring. Because of this, clarification is prone to process upsets. For example, a sludge blanket might disappear from excessive sludge draining (especially during the nightshift where visibility is an issue) and subsequently causes high turbidity in effluent water.
When this happens, a downstream sand filtration system is the last resort to ensure acceptable suspended solids concentrations in the finished water, thus requiring extra care. In this article, the author outlines proven tuning and troubleshooting techniques to improve your sand filters’ reliability and robustness. Although pressure sand filters are used as examples in this article, the main ideas expressed here are applicable to other types of sand filters or similar pieces of equipment.
Sand filter operation
Pressure sand filters are typically filled with multiple filter media (for example, sand or anthracite) to enable deep-bed filtration mode. The use of different filter media is the main reason why they are also called multimedia filters. As shown in Figure 3, anthracite, with a larger particle size diameter, is placed on top of smaller-diameter sand to trap larger-sized flocs/particles. This is followed by gravel as a support. As a typical design standard, flow distributors are equipped to aid flow distribution in all operating steps.
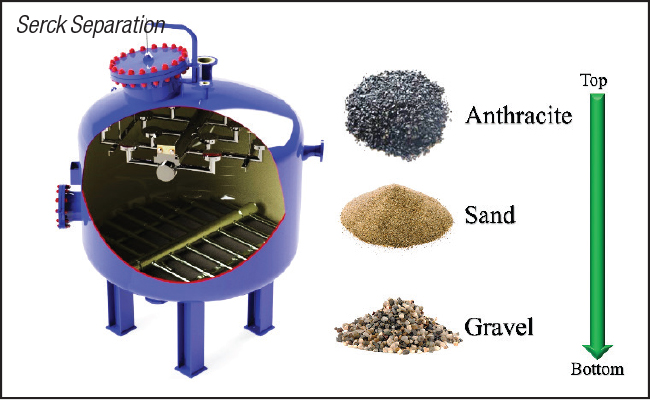
Figure 3. A standard sand filter’s internals and simplified loading scheme may include multiple media used for better filtration (image courtesy of Serck Separation Technologies)
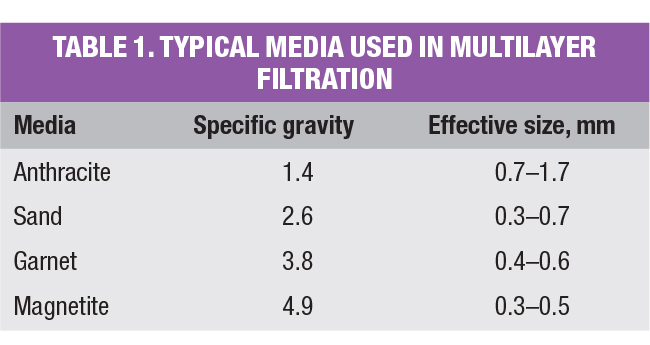
Table 1 summarizes the standard size and density of filter media used in multilayer filtration. For most designs, a filtration system consists of multiple filter vessels to allow periodic backwash without filtration operation being interrupted.
As time progresses, the pressure drop across these filter vessels will gradually increase. Once the pressure drop reaches the maximum limit (typically 1.0–1.2 bar for pressure filters), these filter vessels need to be cleaned (backwashed) to remove trapped particulate matter, so they can again return into service. Some operators use a turbidity breakthrough as the main criterion, while others just set a fixed timer to trigger backwash operation (for example, every 24 hours).
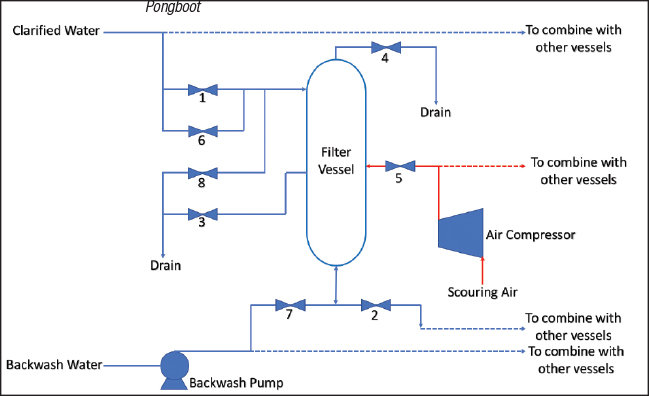
Figure 4. A typical sand filter setup is shown here. Only one vessel is outlined here, because all vessels are identical
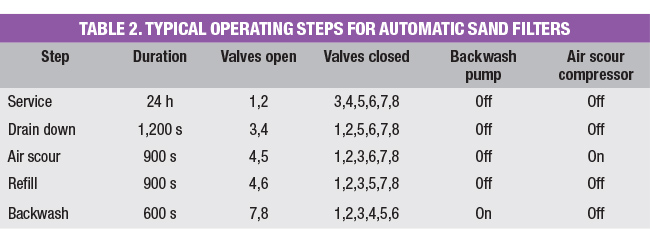
Most sand filtration designs are relatively simple (Figure 4). They usually employ a set of automatic on-off valves to enable each of the operating steps shown in Table 2, along with other peripheral equipment, such as a backwash pump and air-scouring compressor. Generally, a programmable logic controller (PLC) controls these operating sequences, determining, for example, which valves need to be opened or closed, or when the backwash pump should be started or stopped.
Routinely, these filter media need to be fluidized and expanded to a certain extent by a counter-current backwash flow for cleaning. In general, the degree of bed expansion during backwash operations should be greater than 10% for efficient cleaning, but less than 20% to prevent filter media loss. According to industry surveys, poor backwashing is the most frequent cause of filter failures.
In addition to the degree of bed expansion, the design backwash rate also depends on the size and density of filter media, as well as backwashing technique, but generally falls in the range of 37–61 m/h (as superficial velocity). Various air scouring strategies can be applied to aid backwashing: for example, air-first/water-second or simultaneous air and water. It is very important to use filter media with consistent size and density to ensure the validity of the design backwash rate.
Backwash performance
During a field test, if backwash water is relatively clean at the outset, with insignificant turbidity increase throughout the backwash operation, it often means the backwash flowrate is inadequate to clean the filter media. On the other hand, if there is a significant amount of anthracite (or sand) in the backwash water, the backwash flowrate is too high.
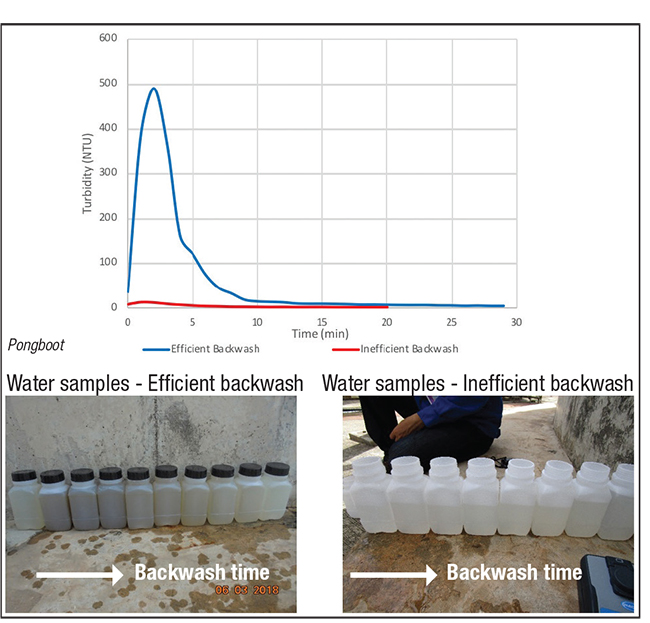
Figure 5. The plot depicts efficient backwash (blue) and inefficient backwash (red), with 1-min sample frequency. Photos by W. Karunkeyoon
Figure 5 shows real-world backwash profiles of two different backwash operations. The blue-colored trend implies that the backwash operation was highly efficient and completed after 10 minutes. Additionally, the turbidity changes in a backwash cycle happened abruptly, with a significant peak in the second minute.
On the other hand, the red-colored trend implies an inefficient backwash operation, indicated by the relatively flat turbidity profile. Regardless of the backwash duration, this filter vessel would never be thoroughly cleaned.
As a general criterion, the American Water Works Assn. (AWWA; Denver, Colo.; www.awwa.org) has recommended terminating backwash when the turbidity is in the range of 10–15 NTU [1]. In addition to water loss, excessively long backwashing is also detrimental to the filtration process, contributing to post-backwash turbidity breakthroughs and requiring an extended ripening period.
Valve opening and backwash
Many sand filtration systems, especially old or lower-budget units, do not have a dedicated flowmeter for backwash flow monitoring. Most of them rely on the valve opening for these on-off valves. As illustrated in Figure 6, both positioning bolts (circled) can be varied up to a certain degree to regulate the backwash flowrate. In other words, these on-off valves serve two purposes in applications such as these. Namely, as an on-off valve for sequential control and as a fixed-opening control valve for regulation of flow.
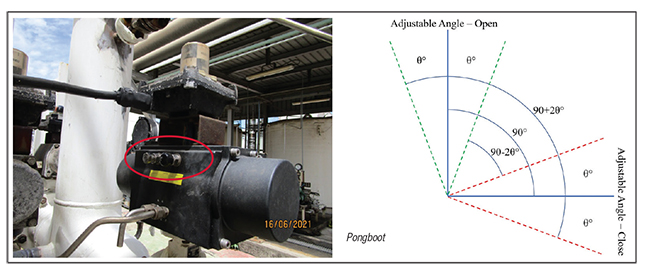
Figure 6. Valve opening can be adjusted by varying positioning bolts (circled). Photo by K. Lertwimolkasem
The valve actuator’s nominal rotational angle in Figure 6 is 90 deg, but can be varied between 90±2ϴ deg by altering the insertion length of the positioning bolts. The span of the rotational angle varies by actuator models and bolt lengths.
In addition to on-off valves, some units install dedicated regulating valves to adjust the backwash flowrate. As a preventive measure, these regulating valves should be locked with a car seal once the backwash flowrate is tuned to prevent accidental adjustment.
Inefficient backwash problems
The functionality of these on-off valves is crucial to a successful operation. Their rotational movement should be smooth, while the seat tightness should be acceptable.
An adequate maintenance program is a key to success, but at the same time, it could also be a burden.
As part of preventive maintenance, these valves are periodically disassembled, repaired and tested at a local maintenance workshop. Sometimes, an operator might observe malfunctions and request valve maintenance, which usually means more or less the same maintenance steps need to be performed.
In the authors’ experience, these good intentions have often turned into a disaster. Many instrument technicians do not realize how important it is to have a positioning bolt optimally adjusted. They just follow the standard maintenance procedure and put these valves back in place. More frequent than people think, they do so without inspecting the insertion length of positioning bolts.
Quite often, the insertion length of these positioning bolts deviates from their optimal position after valve maintenance. More often, the engineer in charge does not even notice if the valve was removed for repair, as an area operator or shift supervisor is typically the one who gives maintenance permission.
For a well-equipped system, there will probably be a flowmeter for backwash flow monitoring. After the valve returns into service, a board operator or an engineer can monitor from a control room whether the backwash flowrate deviates from the original value. Ideally, the backwash flowrate would be the same as before, and thus there would be no need for further adjustment. Conversely, field adjustment would be required if there are any significant deviations.
As mentioned earlier, these water treatment units are mostly budgetary. Some units are just outdated and poorly designed, especially when they are used as a support unit (as part of a petroleum refinery). In the past, one author (Pongboot) used to operate both a meticulously designed hydrocracker and a very poorly designed water treatment system at the same refinery. More often than people think, there is no flowmeter available for backwash flow monitoring.
Failure to detect these anomalies can lead to performance issues of filtration systems. In one instance, some filter vessels hit the maximum allowable pressure drop in a short period after each backwash. To identify the problem, one of the authors (Pongboot) traveled to the site for investigation and found a significant amount of anthracite in water samples taken during backwash operations. These observations implied that these filter vessels had already lost their deep-bed filtration capability (for example, from excessive anthracite loss). The filtration mechanism had become cake filtration, where most of the carried-over sludge accumulated at the top of the sand layer, rather than between, voids of an anthracite bed, causing premature plugging and a sharp rise in pressure drop. In this particular case, there was no flowmeter installed to monitor backwash operation.
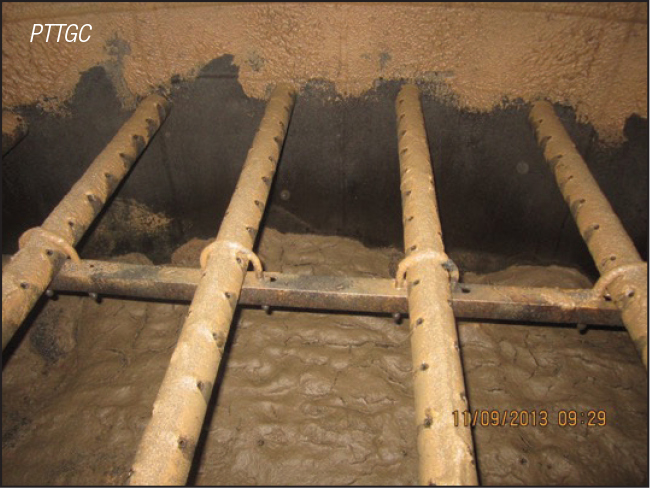
Figure 7. A severely plugged multimedia filter is shown here. A top surface of anthracite was fully covered by carried-over sludge from an upstream clarifier. This phenomenon can also occur when the anthracite layer is inadequate to enable deep bed filtration; for example, from anthracite loss
Similarly, an inadequate backwash flow also results in premature plugging of filter media, and it could be as bad as the situation shown in Figure 7. The pressure drop across filter vessels will sharply increase over a short time and result in an unacceptably short cycle length with possible premature turbidity breakthrough. Additionally, overly frequent backwash operation resulting from premature plugging often causes water balance issues. On several occasions, the author (Pongboot) could tell that the backwash flowrate was far too low by just observing backwash water flowing into the underground drain.
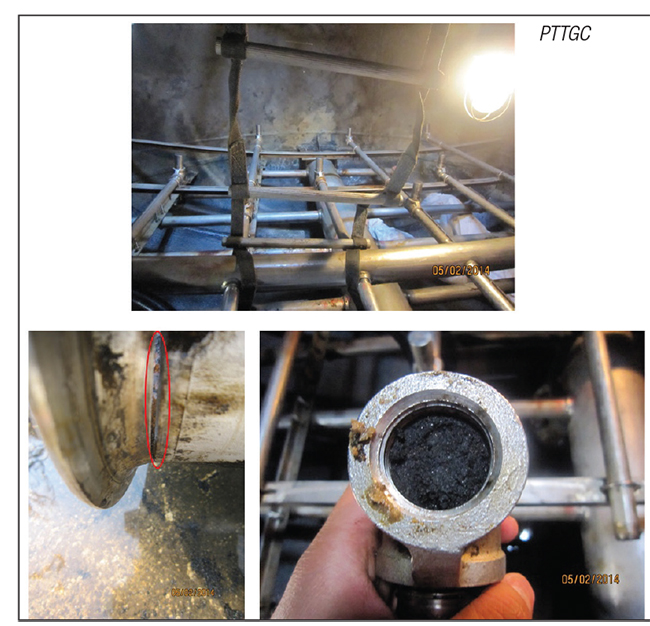
Figure 8. A damaged and severely plugged air distributor with a gap (highlighted by the red circle). In this example, the air distributor was severely bended by excessive pressure drop
Apart from the issues mentioned above, an excessively high pressure drop can also lead to internal damage. For example, the air distributor’s welding seam shown in Figure 8 was cracked due to the chronic high-pressure drop, thus creating a gap that allowed anthracite and sand to enter, then plug, air passages. The occurrence of air distributor damage rendered air scouring ineffective.
After observing a significant amount of anthracite present in the backwash water, the author then inspected each on-off valve associated with the backwash operation (valve numbers 7 and 8 in Figure 4). As per the author’s inspection, some positioning bolts were misplaced (insertion lengths were too short). In other words, these valves had an overly wide opening, which in turn resulted in an excessively high backwash flowrate and losses of anthracite. A decision was made to reload new filter media into these filter vessels. As expected, the author observed a nearly complete loss of anthracite upon inspection. This finding was in line with the fact that these filter vessels had already lost their deep-bed filtration capability.
Upon completion of reloading, these newly loaded filter vessels were then commissioned. As previously pointed out, the insertion length of these positioning bolts was insufficient and needed to be re-adjusted. Backwash flow adjustment is a very challenging task when there was no flowmeter available. At this large production scale, measuring the water rise rate is not always practical, unless your sand filters are the open type (open gravity filters). For open gravity sand filters, the open filter vessel can be utilized as a level measuring chamber for backwash flowrate estimation, which is not the case here.
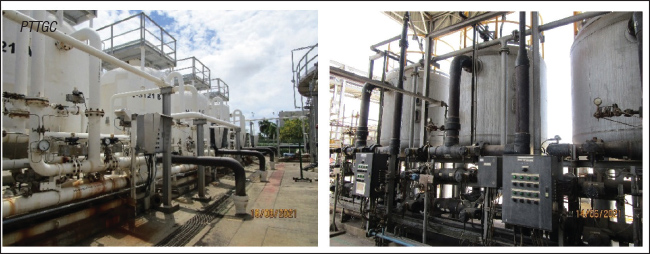
Figure 9. These photos show a typical sand filter layout with numerous bends and short pipe sections
One might consider using non-intrusive flow sensors, such as an ultrasonic flowmeter. This is a good option, providing there is an adequate pipe straight-run. Unfortunately, these filter vessels and backwash systems are usually located close to each other and often in cramped spaces. Piping systems typically consist of many bends and relatively short pipe sections, rendering ultrasonic flowmeters useless (Figure 9). Some piping materials, such as low-density plastics and rubber (or even thick paint), can attenuate signals or possibly create false echoes, causing inaccurate flow measurements.
A trial-and-error approach could also be carried out for a single filter vessel to determine the optimal backwash flowrate by evaluating the turbidity of backwash water, for example. However, this is not a trivial exercise. Even if the optimal backwash flowrate is eventually determined, a more critical question is how to ensure the same backwash flowrate for every filter vessel. The piping systems connecting these filter vessels are mostly asymmetric. Consequently, the backwash flowrate of each filter vessel will not be the same, despite the fact that all backwash inlet valves (valve no. 7 in Figure 4) have the same opening.
Guide to backwash tuning
One technique that the authors have successfully applied in the past is to estimate the backwash flowrate using the pump characteristic curve. This technique has been proven to be effective and consistent on many occasions. If there is no flowmeter available onsite, one may consider the following recommendations:
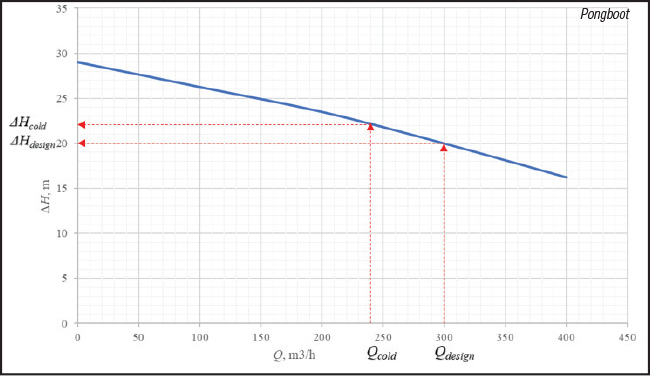
Figure 10. A graphical demonstration of ∆H determination is shown here
Recommendation 1. Have a clear flowrate target (Q) in mind, then determine a corresponding differential head (∆H) from the pump characteristic curve (Figure 10). The authors recommend using the design backwash flowrate (Qdesign) as a starting point. This corresponding ∆H can be converted into a differential pressure target across the main pump using the following formula.
Pdischarge – Psuction = ρwater g∆H (1)
Where:
Pdischarge is a pressure reading of the pressure gage located at the discharge of the main pump
Psuction is a pressure reading of the pressure gauge located at the discharge of the spare pump
ρwater is the water density
g is acceleration due to gravity
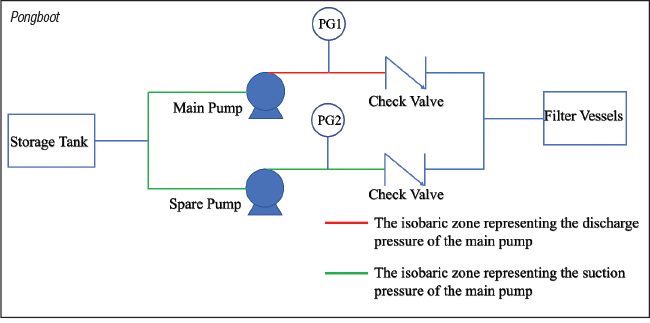
Figure 11. A simplified illustration of a typical backwash system and its isobaric zones
For a deeper understanding of how to use field data, consider the system depicted in Figure 11. The main pump is in service, delivering water for a backwash operation. In this particular case, Pdischarge is a pressure reading of PG1 (indicated by the red isobaric zone in Figure 11), while Psuction is a pressure reading of PG2. In other words, PG2 is an indirect indication of the suction pressure of the main pump, as indicated by the green isobaric zone highlighted in Figure 11.
If no spare pump is available, just read a pressure gage located at the discharge line to estimate Psuction before commencing the backwash operation. Based on the author’s experience, this is an acceptable assumption, and usually sufficient for practical purposes (a reasonable guess is the objective here, not an exact solution).
Recommendation 2. Tune the backwash flowrate by adjusting the insertion length of the corresponding positioning bolts (valve no. 7 or 8 in Figure 4). A good strategy is to start at a low flowrate to prevent filter media loss, for example, at 50% of the full insertion length, then gradually increase the insertion length until the estimated backwash flowrate matches the design value. Another advantage of this tuning strategy is that corresponding positioning bolts will not be pushed against the instrument air pressure, reducing the amount of effort required for the field adjustment. For most cases, a design value is good enough to achieve efficient backwashing.
Recommendation 3. After finishing a preliminary adjustment, it is recommended to repeat the backwash performance test described earlier. If the performance is still unsatisfactory, consider increasing the backwash flowrate by 10%. The authors do not recommend going beyond 10% because it might result in excessive loss of filter media. In case the backwash performance is still unsatisfactory after increasing the backwash flowrate, the actual root cause of inefficient backwash operation should be identified (for example, an air scouring step might not be effective).
Recommendation 4. Seasonal temperature variations can be substantial in some areas. The colder the water is, the more filter media will expand at the same backwash flowrate. The authors recommend tuning the backwash flowrate at the design value during the warm season and periodically checking for filter media loss during the cold season by observing backwash water. These seasonal variations are another reason why the authors do not recommend adjusting the backwash flowrate beyond 10% of its design value (a typical design factor). Table 3 provides correction factors for standard sand and anthracite at different temperatures as a starting point for tuning.
During cold seasons, Equation (2) can be employed to estimate the required backwash flowrate. For better clarity, the authors will demonstrate its use in the subsequent example.
Qcold = Cd × Qhot (2)
Where:
Qcold is an estimated backwash flowrate for the cold season; Qhot is a tuned backwash flowrate from the hot season; and Cd is a derating factor, a ratio between two corresponding correction factors of two different water temperatures for the same size and type of filter media
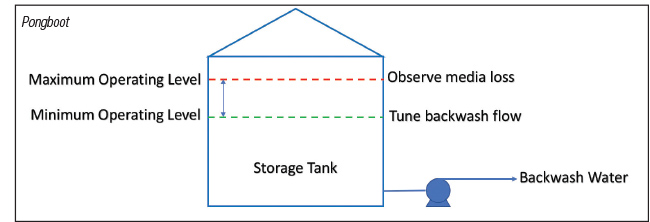
Figure 12. This diagram shows a tuning strategy for varying water level
Recommendation 5. To ensure good backwashing over a comprehensive range of water levels in the storage tank, tune the backwash flowrate when the water level is at the minimum, then observe filter media losses at the maximum controlled water level (Figure 12). Ideally, there should be minimal anthracite (or sand) loss over the entire controlled range. In the case of excessive media loss at the maximum water level, the author recommends raising the minimum level and readjusting the backwash flowrate, so it will not increase too much at the maximum water level.
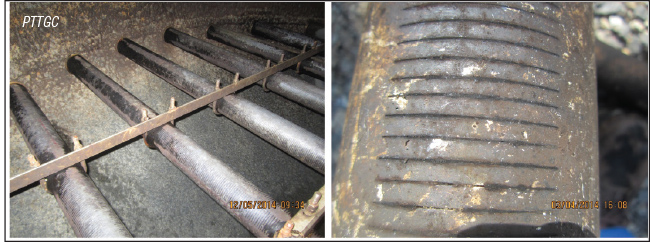
Figure 13. The photo shows a blocked underdrain distributor. This underdrain distributor has water passages that are too narrrow, making it susceptible to plugging and extremely difficult to unblock
Recommendation 6. If the backwash tuning fails to achieve the design flowrate even at the full valve opening, engineers should check for other possible issues. Figure 13 shows an example where fine dirt particles blocked almost 100% of the underdrain distributor.
A real-world example
On a hot summer day in a refinery in Southeast Asia, an engineer tried to optimize the backwash flowrate for four identical dual-media filter vessels containing anthracite and sand. From a design reference book, the engineer found that the design backwash flowrate (Qdesign) is 300 m3/h at 30°C. This water-treatment plant was suffering from high pressure drop across multimedia filters.
Unfortunately, this refinery does not have a flowmeter for backwash flow monitoring, leaving this engineer no choice but to use the pump characteristic curve in Figure 10 and field pressure data to estimate the backwash flowrate. The backwash system this engineer was dealing with is similar to what presented in Figure 11.
Practical backwash tuning. From Figure 10, the corresponding differential head (∆H) for 300 m3/h of backwash flow is 20 m. As it was a hot day, the water temperature was approximately 30°C with water density of 996 kg/m 3.
By applying Equation (1), the differential pressure target can be determined as follows:
Pdischarge – Psuction = 996 kg/m3 × 9.81 m/s2 × 20m = 195,415.2 Pa (1.95 bars)
This calculated differential pressure will be a target for the field tuning.
To ensure the pump curve’s validity, the engineer first confirmed with the refinery’s maintenance department that both backwash pumps were still in good condition. Everything from actual blade size to failure record was thoroughly reviewed and accepted. Therefore, the pump characteristic curve illustrated in Figure 10 should provide a good flowrate estimation.
Before commencing the backwash operation, the positioning bolt of the backwash inlet valve (valve no. 7 in Figure 4) was pre-adjusted at approximately 50% of the full insertion length as a preventive measure to prevent excessive filter media loss.
Regarding initial field pressure data, he found that Pdischarge – Psuction was 2.50 bars (approximately 150 m3/h of backwash flow), while the target is 1.95 bars. Consequently, an instrument technician adjusted the bolt length so the differential pressure became as targeted (approximately 1.95 bars).
More than that, a visual check of backwash water also confirmed that the backwash flowrate was too low to expand the filter media, because the water appeared quite clear. Once the differential pressure approached 1.95 bars, a significant amount of sludge and silt had been observed in the backwash water, with a negligible amount of anthracite. The dirty appearance of backwash water implied an efficient backwash operation. It was also proof that the differential pressure target of 1.95 bars worked, although a full backwash performance test would still be required.
Ensure robustness against fluctuations in the water level. On the day this engineer adjusted the backwash flowrate, he asked the board operator to reduce the water level in the storage tank to 85%, the minimum level.
To ensure the system’s robustness, he also monitored the backwash operation when the water level was at 95%, the maximum level.
As per the field monitoring, he found minimal anthracite in the backwash water, with the estimated backwash flowrate of 310 m3/h (or 3% above design) using the same technique described earlier. Ideally, the maximum and minimum water level should be properly controlled to ensure efficient backwash operation and minimal media loss.
Minimize risks of media loss from temperature variations. At 85% water level and 30°C, the tuned backwash flowrate during the hot day (Qhot) is 300 m3/h. This system utilizes 1.0 mm of anthracite and 0.5 mm of sand.
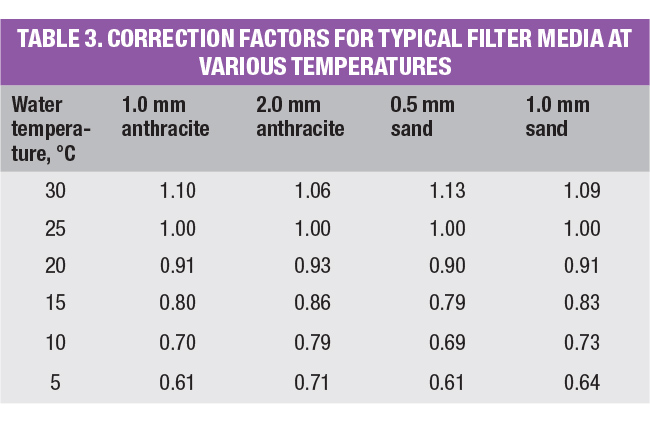
Historically, the temperature could drop significantly, to 20°C (water density is 998 kg/m3), thus requiring a lower backwash flowrate (denoted by Q cold in Figure 10). From Table 3, the derating factor (Cd) for 1.0 mm anthracite is 0.91/1.10 (a ratio between correction factors at 20°C and 30°C, highlighted in blue in Table 3) or 0.83. In the same fashion, Cd for 0.5 mm sand is 0.90/1.13 (highlighted in green in Table 3) or 0.80.
The authors recommend using the lower Cd for correction to minimize the risks of filter media loss. From Equation (2), Q cold can then be calculated as follows:
Qcold = 0.80 × 300 m3/h = 240 m3/h
From the pump characteristic curve in Figure 10, the corresponding ∆H for cold season (denoted by ∆Hcold in Figure 10) is 22.0 m water.
Thus, Pdischarge – Psuction = 998 kg/m3 × 9.81 m/s2 × 22.0m = 215,388.4 Pa (2.15 bars)
When the water temperature is 20°C, one can use 2.15 bars pump differential pressure as a first guess, then observe the actual backwash performance and adjust as needed.
Final recomendations
For poorly designed or existing systems where no flowmeter is available for backwash flow monitoring, the outlined tuning technique has been proven to be highly effective and provide consistent backwash flowrate. The authors recommend installing a dedicated flowmeter for new units or retrofits to the existing plant for early detection of any anomalies. Although it still requires a field check to ensure problem-free backwash operation, the proposed technique is nonetheless useful to verify the accuracy of a flowmeter.
Create a transparent logging system to ensure everyone involved in process monitoring can track the status of valve maintenance. For example, the unit engineer can create a dedicated section in the shift report for any critical valves currently under maintenance.
Communicate with all instrument technicians to ensure they fully understand the effects of positioning bolts on filter operation. For troublesome clarifiers, where sludge carryover is frequent, the authors recommend setting the backwash flowrate at 10% above the design value to handle potential clarifier upsets. One may consider installing a real-time sludge level detector for better sludge level monitoring.
Create a task for a field operator in charge to monitor the backwash operation, at least once a month for every filter.
Seasonally or quarterly, conduct backwash performance evaluation. The optimal backwash flowrate for each season should be appropriately documented for future reference. Be careful when extending the time interval between each backwash, for example, from 24 to 36 hours, as trapped flocs/particles will become more difficult to remove. A backwash flowrate or duration should be adjusted accordingly to ensure efficient backwashing.
The same tuning technique can also be applied to other systems with similar configurations, such as activated carbon filter or sand filters in wastewater treatment units.
Edited by Scott Jenkins
References
1. Filter Maintenance and Operations Guidance Manual, AWWA Research Foundation, 2002.
2. Handbook of Industrial Water Treatment, Suez, [Online] Available at www.suezwatertechnologies.com.
Authors
 Nattapong Pongboot is a senior consultant at Global R&D Co. Ltd (Samut Prakarn, Thailand); Email: nattapong.globalrd@gmail.com or nat.pongboot@gmail.com; Phone: +66-87-665-6015. Pongboot is an experienced chemical engineer with broad experience in refining and petrochemical technologies. Earlier in his career, he spent several years solving problems in water treatment plants. Before partnering with Global R&D, he held various technical roles with Honeywell UOP, PTT Global Chemical and SCG Chemicals with good exposure to process design, plant operation, troubleshooting and optimization. Additionally, he is also a technical instructor for www.chemengedu.com. He obtained both B.Eng (ChE) and M.Eng. (ChE) degree from Kasetsart University.
 Wiroon Tanthapanichakoon is currently the managing director of Global R&D Co. Ltd. (Samut Prakarn, Thailand (Email: wiroont.globalrd@gmail.com; Phone: +66-83-177-8108. Tanthapanichakoon has several-years of combined experience with ExxonMobil and SCG Chemicals in Thailand. He has authored several international papers and technical articles, and also holds some technology patents under his name. He founded a chemical engineering training platform called “ChemEngEdu” (www.chemengedu.com). He has conducted several public and in-house training courses on topics in chemical engineering, process and equipment design and scale-up for more than 2000 engineers. He is a senior professional engineer in Thailand.
 Wirinya Karunkeyoon is a process engineer with PTT Global Chemical (Thailand; Email: Wirinya.k@pttgcgroup.com; Phone: +66- 3897-1759 or +66-83-233-6244). Karrunkeyoon has several years of experience in water treatment, power generation and diesel hydrotreating. She is currently affiliated with PTT Global Chemical (Site 6: Refinery) in Thailand. She obtained her B.Eng. (ChE) degree from King Mongkut’s University of Technology North Bangkok and M.Eng. (ChE) degree from King Mongkut’s University of Technology Thonburi.
 Kanyaporn Lertwimolkasem is affiliated with PTT Global Chemical, and is an experienced process engineer (Kanyaporn.L@pttgcgroup.com or Kanyaporn.lert@gmail.com). She has expertise in water treatment, power generation, steam reforming, mercaptan oxidation and crude distillation. She is currently works at the PTT Global Chemical Site 6 Refinery in Thailand. Before PTT Global Chemical, she spent two years working for Technip Engineering. She obtained both B.Eng. (chemical engineering) and M.Eng. (chemical engineering) degrees from King Mongkut’s University of Technology in Thonburi in Bangkok, Thailand