Advanced analytics applications are a key component to create actionable insights using statistical analysis techniques
In chemical manufacturing, deviation monitoring and detection play a key role in safeguarding production, reliability, and product quality. However, different processes often require different tools and methods to accurately detect statistically significant deviations. Statistical process control (SPC) and statistical quality control (SQC) analyses can provide meaningful insights for process improvement, as well as early warning signs of process deviations — but operational challenges and lack of specialized tools make it difficult to develop robust SPC solutions.
Beyond simple detection and monitoring, chemical manufacturers must quickly identify the root cause of the deviation and prevent recurrence. Acting on insights requires clear and concise reporting that details the nature of the issue, and these reports must be quickly and widely shared. This operationalization, or move from insight to action, forms the final piece of a viable SPC/SQC solution in both continuous and batch manufacturing.
Using advanced analytics applications, chemical manufacturers can minimize time to insight by leveraging SPC/SQC analyses and combining them with near-real-time reporting to generate actionable insights. Armed with these insights, subject matter experts (SMEs) and operations personnel can react to run rule deviations, limit the duration and magnitude of process excursions, and proceduralize mitigation strategies to eliminate recurrence.
What is statistical process control?
Statistical process control describes a set of rules and techniques used to detect process deviations. Every process is subject to a routine and expected level of variation. However, atypical deviations can cause unexpected and unwanted process outcomes, such as product degradation, changes in physical properties, changes in process throughput, and unsafe working conditions. Determining when a process moves from routine variation and into the realm of deviation can be very challenging.
Fortunately, SPC includes tools such as control charts and run rules to help SMEs detect and rectify process deviations. Control charts lay out the upper and lower bounds of the controlled process, and anything out of bounds constitutes a deviation. Then, within the upper and lower bounds, additional run rules can be added to aid in pattern recognition and deviation detection.
Bridging the gap between process and product data
A modern chemical process generates vast amounts of data continuously. These data can range from flowrates, temperatures, pressures and vibration, to a host of laboratory-measured quality parameters specific to a particular production process. The landing place for these data are various time series data storage systems, including process data historians, batch databases, manufacturing execution systems, laboratory information management systems and others.
This wealth of diverse sensor and contextual data, wherein lies opportunity to gain full situational awareness of the manufacturing process, often presents a challenge. The collected data residing in different databases or historians means that SMEs must take on the task of aggregating the necessary data to perform their analyses. Leaning on legacy tools such as Excel spreadsheets for data wrangling via individual queries to the various source systems quickly becomes cumbersome (Figure 1).
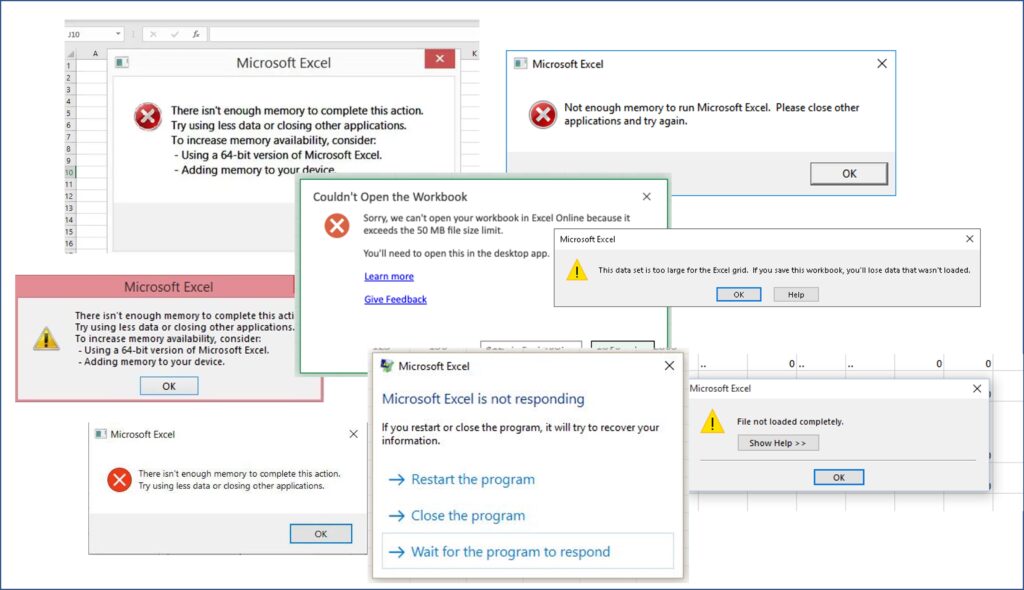
FIGURE 1. Common spreadsheet issues when working with large amounts of time series data
Additionally, the misalignment among time stamps from different data sources, often up to hours due to the time required to analyze samples in a laboratory, further hinders the development of SPC/SQC analyses. Particularly with quality samples that require laboratory analysis, the lag between the time the sample was observed in the field and when it enters the database makes an apples-to-apples comparison with process data difficult. Using legacy tools, the timestamps need to be realigned as best they can to match the process data timestamps. This alignment is paramount when looking for patterns between process conditions and their effects on product quality.
Finally, different types of chemical processes present unique challenges to creating robust SPC/SQC analyses. Continuous processes producing a single product, such as commodity chemicals, represent the simplest case. Outside of startups and shutdowns, the SPC/SQC control limits and run rules should remain roughly consistent. However, if a continuous process runs multiple product grades, the limits are likely to shift when switching among grades. Target values for critical process parameters such as viscosity, density, and temperature are likely to change, forcing SMEs to create nimble analyses that can easily account for product grade changes.
Batch processing is fundamentally different and requires an entirely different approach to SPC/SQC analysis. Instead of process and quality parameters remaining steady, they change with time, every batch. Using legacy tools, subdividing batches into its constituent phases can be very challenging and time-consuming.
Empowering SMEs to connect, analyze, and operationalize SPC/SQC analyses
SMEs sit at the intersection of process and quality data. As the first group called when a process or quality parameter begins to drift, they must quickly ascertain the effects of intentional process changes and unit upsets on final product quality and throughput. The disparate nature of different data sources necessitates a need to unify data prior to analysis.
Process manufacturers can bring data sources together in a variety of ways, such as creating a data lake, or extracting, transforming and loading the data sources to the cloud. Alternatively, advanced analytics software can connect to and unify a manufacturer’s data sources by linking to all databases, without the need to copy or change the source data. SMEs can then deep dive and begin to unearth trends, along with fundamental relationships between process variables and product quality.
After connecting their disparate data sources to a single application, SMEs can begin to search for patterns and relationships between process data and quality, the crux of any SPC/SQC analysis. Rooted in statistics, SPC run rules formalize this process and lay out when a process begins to deviate in a statistically significant way. Typically, manufacturers use a series of run rules to measure process variation and deviation. First, all data points should be between the upper control limit (UCL) and the lower control limit (LCL). These are the guard rails of the control chart.
Zone rules help describe activity within the UCL and LCL. The area between the control limits is subdivided into six zones, three on each side, A, B, and C. Each zone is one standard deviation wide, thus the area inside the control limits is +/- 3 standard deviations, accounting for 99.73% of data points. A series of data points in a particular zone can be an early sign of process deviation. Two consecutive points in Zone A (+/- 3), four out of five in Zone B (+/-2), or seven consecutive points in Zone C (+/-1) all constitute a deviation and should be investigated. Other run rules include seven consecutive points trending up or down, or seven consecutive points on one side of the mean.
Developing robust control charts and run rules for a process or product can help improve product quality, decrease downtime, and increase throughput, but SMEs need a tool to adapt these run rules to their process. Which parts of the process warrant a control chart? Will the control chart easily accommodate a product switch? With customized run rules and control charts, SMEs can move to the next phase of a robust SPC program.
To fully realize the potential of their newly created process specific run rules, SMEs must be able to seamlessly share information surrounding deviations and insights with plant operations staff. The value of these analyses stems from not only quickly identifying and correcting deviations, but from the knowledge gained through pattern recognition and root cause analysis, thus preventing recurrence. In this way, operationalizing SPC/SQC analyses plays a key role in continuous improvement and overall equipment effectiveness cultures in chemical manufacturing.
Use Cases Leveraging Modern Technologies
The specifics of deploying SPC analyses will depend on each individual process, however, high level use case examples, like the ones below, can help chemical manufactures understand how to dive deeper into their processes to uncover relationships between process inputs and outputs.
Use Case 1. Near-real-time deviation detection & monitoring using SPC run rules
SPC run rules lay out precisely when a process begins to become statistically out of control, so the first step to implementing any SPC/SQC program is to establish run rules for a particular product or process. With continuous processes, manufacturers may need different control limits for different products or grades. Using an advanced analytics application, SMEs can quickly establish control charts for key process parameters such as level, flow, temperature and pressure. Once established, conditions within the application will automatically create capsules (user-defined slices of time with unique identifiers) if a process parameter of interest goes above or below a UCL or LCL. A single data point above the UCL or below the LCL constitutes a process deviation.
Other run rules require a more sophisticated analysis but can still be accomplished using an advanced analytics application. Using an advanced analytics application, SMEs can quickly establish product specific UCLs and LCLs, and A, B, and C zones between the limits and the target to help better understand deviations that do not exceed the control limits. These control charts can change based on product grades, as shown in Figure 2.
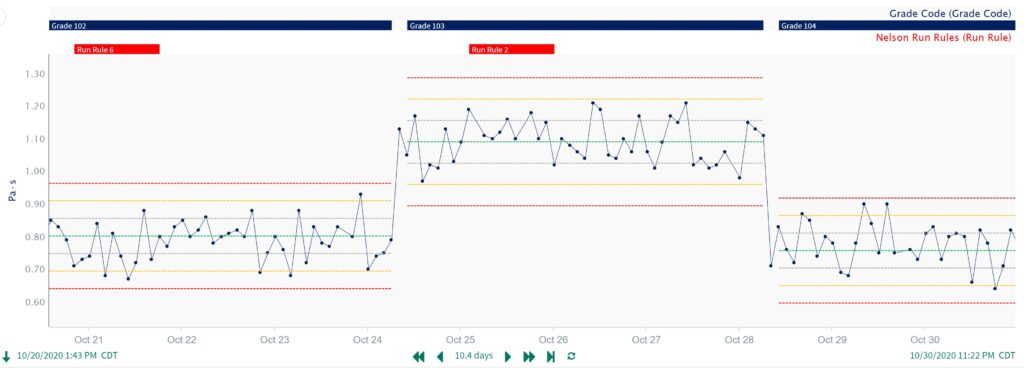
FIGURE 2. Grade specific control charts in an advanced analytics application
Once established, an advanced analytics application can plot a rolling average using the SME’s time range of choice (for example hourly, daily or weekly). Once in place, SMEs can implement more complex run rules to detect a series of points above or below the average, or a trend of increasing or decreasing data points, indicative of the process moving away from the mean.
Importantly, advanced analytics applications enable SMEs to quickly share the occurrence of a deviation, along with a report that aggregates all the SPC control charts associated with a particular process. Advanced analytics applications can notify SMEs and operations personnel of deviations, helping to rectify these issues as quickly as possible. SMEs can also quickly create reports for impromptu meetings or internal circulation, enabling manufacturers to better track their progress as part of continuous improvement initiatives.
Use Case 2. Identifying variation parallel processes
Often in chemical manufacturing, production of a product is subdivided into parallel, identical processes or trains, either to increase throughput or add redundancy. It is common for these processes to subtly vary, even though they are ostensibly identical. Typically, operations personnel are aware of these subtleties and how they manifest. Perhaps one train fouls more quickly than the other, or one requires more catalyst than the other.
Combining SPC tools and an advanced analytics application, SMEs can decouple and compare the individual components of the trains and see how they vary. Are the standard deviations of key process variables different between the trains? Where is one train seeing SPC deviations compared with the other? Zeroing in on the nature of the variation can help uncover its cause. Once known, engineers can decide if addressing the source of the variation is economically viable, and then use the SPC analysis for project justification.
In addition to implementing run rules for specific products and processes, an advanced analytics application can connect to disperse data sources, enabling SMEs to analyze them together. Using advanced analytics tools, SMEs can begin to unearth the relationship between process variables and product quality. Once the data sources have been connected, SMEs can time scale quality data to match the process conditions when a sample was taken, rather than when it was processed in a lab. Once scaled, the process and quality data can be analyzed on the same scatter plot to help visualize the correlation between the two, as shown below in Figure 3.
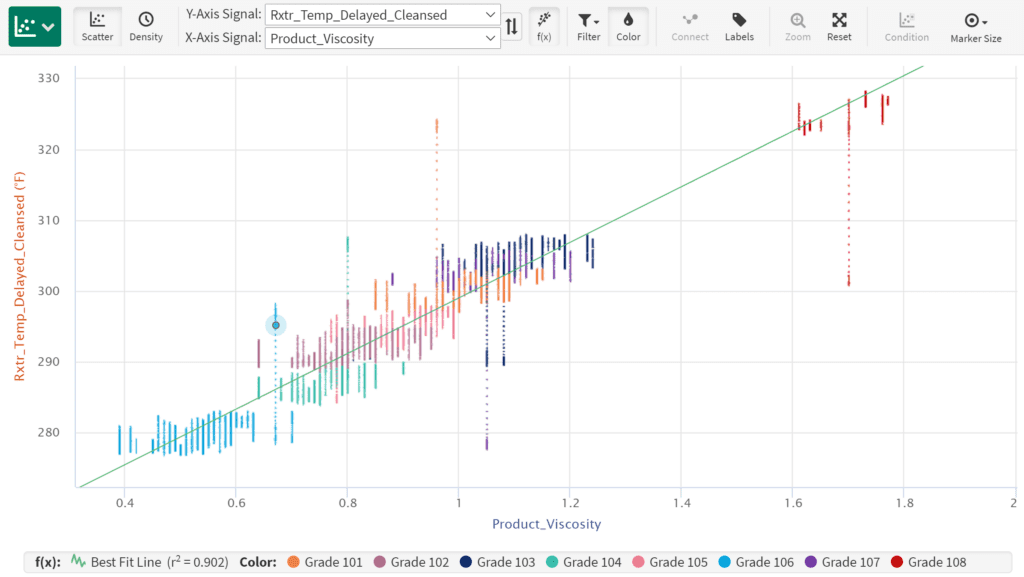
FIGURE 3. This scatter plot overlays process and quality data
In an SPC context, overlaying process quality data can help determine when process deviations cause quality issues, or more specifically, what kind of quality issues are associated with certain types of process deviations. Do certain SPC deviations create unwanted byproducts, affect particle size, viscosity, color, or some other quality parameter?
Additionally, an advanced analytics application’s correlation analysis capability allows SMEs to determine which process variables are most highly correlated with key quality parameters. With this knowledge in hand, process engineers can build out predictive models to predict when quality abnormalities may occur, and then depict this information in a correlation matrix (Figure 4).
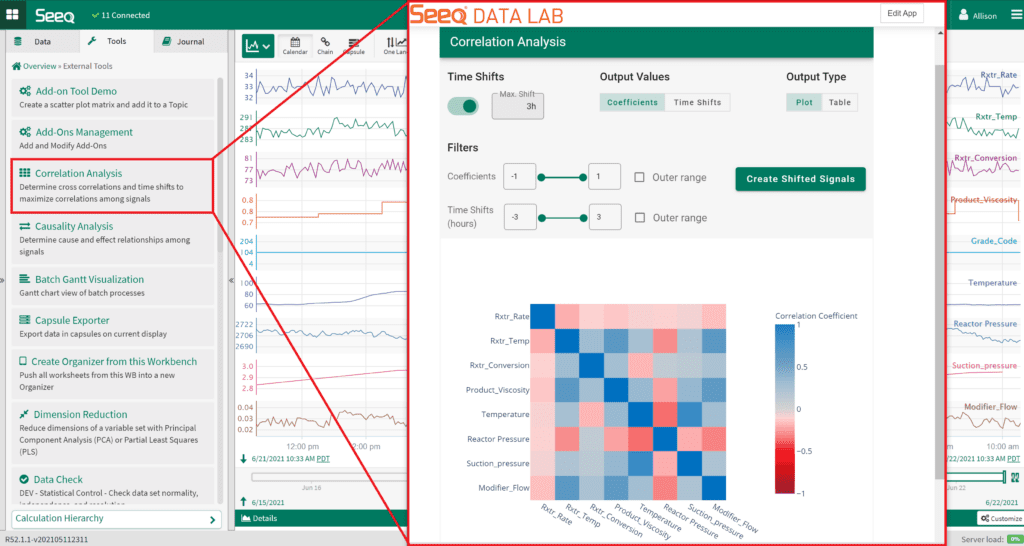
FIGURE 4. Process engineers can build out predictive models to predict when quality abnormalities may occur, and then depict this information in a correlation matrix
Moving forward with SPC
Using advanced analytics applications, SMEs can build out product specific control charts and run rules, and they can create automated reports to share with colleagues and operations personnel. But this only represents the tip of the iceberg, as operationalizing SPC and SQC analyses is merely the beginning of understanding and controlling process variations and deviations in chemical manufacturing.
With these tools implemented, chemical manufacturers can weave an advanced analytics application into their continuous improvement, operational excellence, and overall equipment effectiveness programs. With that in mind, control charts, UCLs, and LCLs should ideally narrow as process variation decreases through increased process knowledge, new procedures, and process modification.
About the Author

Katie Pintar is an Analytics Engineer at Seeq Corp., where she helps companies maximize value from their data. She has a process engineering background with a B.S. Ch.E from Montana State University. Pintar has over five years of experience working for chemical manufacturers to optimize existing processes and develop processes for new materials, scaling them from the laboratory to pilot plant to full-scale manufacturing. She has expertise in batch and continuous processing for a wide range of chemistries.