Deeper understanding of common alarm-system metrics can improve remedial actions and result in a safer plant
Do you routinely receive “alarm management performance” reports, or are you expected to monitor a managerial dashboard equivalent? What do you look for and what does it mean? We all know that fewer alarms mean fewer operator interruptions and presumably fewer abnormal process or equipment conditions. But a deeper understanding of the more common alarm-management metrics can yield greater insight, leading to more focused remedial actions and ultimately to a safer, better performing plant (Figure 1).

Figure 1. A better understanding of alarm system metrics can lead to more focused remedial actions and help to make the plant safer
This article reviews the now well established benchmark metrics associated with the alarm-management discipline. Most articles previously published on alarm managements cover alarm concepts (for example, defining a valid alarm), alarm management methods (for instance, rationalization techniques), justification (such as the benefits of investing in alarm management) and tools (including dynamic alarming enablers). This article provides a different perspective. Written for process plant operation managers or others that routinely receive alarm management performance reports, this article aims to explain the most common metrics, without requiring an understanding of the alarm-management discipline in depth.
Alarm-management KPIs
The first widely circulated benchmark metrics, or key performance indicators (KPIs), for alarm management relevant to the chemical process industries (CPI) were published in the 1999 edition of the Engineering Equipment and Materials Users Association publication EEMUA-191 Alarm Systems – A Guide to Design, Management and Procurement [1]. Later works from standards organizations, such as the 2009 publication International Society of Automation (ISA) 18.2 Management of Alarm Systems for the Process Industries [2] and the 2014 publication IEC62682 Management of alarms systems for the process industries [3], built upon EEMUA-191 and have furthered alarm-management thought and discipline. For example, they provide a lifecycle framework for effectively managing alarms and establish precise definitions for core concepts and terminology. Yet fifteen years later, little has changed regarding the metrics used to measure alarm-system performance. This consistency in measurement has been positive in many respects, leading to the wide availability of generally consistent commercial alarm analytic reporting products, from both control-system vendors and from companies that specialize in alarm management. Consequently, selection of an alarm-analysis product may be based on factors such as ease of use, integration and migration, reporting capabilities, price, support availability and so forth; with reasonable certainty that the KPIs derived from the chosen product can be interpreted consistently and compared across sites and across differing process control, safety and other open platform communications (OPC)-capable alarm-generating sources.
In addition to defining the KPI measurements, the EEMUA-191, ISA-18.2 and IEC62682 publications also suggest performance targets, based in large part on the practical experience of the companies participating in the committees that contributed to each publication. As an example, these publications state that an average long-term rate of new alarms occurring at a frequency of up to 12 alarms per hour is the maximum manageable for an operator. Suggested performance levels such as this can provide a reasonable starting point if you are just beginning an alarm-management program. But before deciding what constitutes a reasonable set of targets for your site, you should also consider other firsthand inputs, like surveying your operators and reviewing in-house studies of significant process disturbances and alarm floods. Note that more research into the human factors that affect operator performance is needed to validate and potentially improve on the current published performance targets. Important work in this area is ongoing at the Center for Operator Performance (Dayton, Ohio; www.operatorperformance.org).
Alarm system example metrics
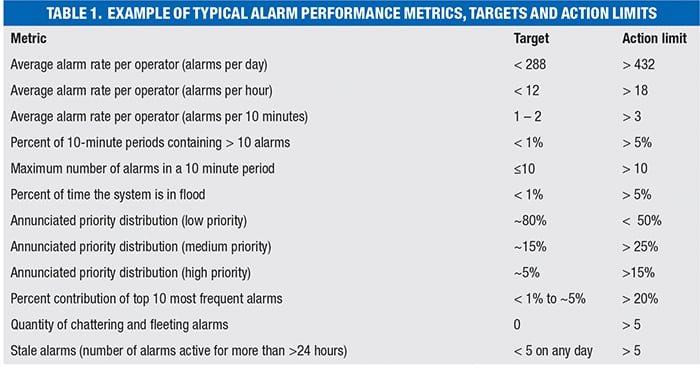
A typical alarm-performance report contains a table similar to Table 1, where the metrics and targets are based upon, and in many cases, copied directly from, the EEMUA-191, ISA-18.2 and IEC62682 publications. It is also common to see locally specified action limits based on a site’s alarm philosophy. When a target or action limit is exceeded, it is important to ask: what problems are likely contributing to the need for action, and what are the actions? These questions are the focus of the following discussion.
Average alarm rate
The average alarm rate is a straightforward measure of the frequency with which new alarms are presented to the operator, expressed as an average count per day, hour or per 10-minute interval. As alarm frequency increases, an operator’s ability to respond correctly and in time to avoid the ultimate consequence of inaction decreases. If the rate is excessively high, it is probable that some alarms will be missed altogether or the operators will ignore them, thus eroding their overall sense of concern and urgency. So clearly it is an important metric.
Averages can be misleading, however, because they provide no sense of the peaks in the alarm rate, making it difficult to distinguish “alarm floods” from steady-state “normal” operation. Consequently, most alarm performance reports supplement this basic KPI value with a timeline view or separate calculation of alarm rates for both the times when operation is normal and for times of an alarm flood. Figure 2 presents a typical example. The average alarm rate of 16.5 alarms per hour exceeds the target KPI value of 12 from Table 1, but is slightly less than the action limit of 18 per hour, and so might not raise concern, while the timeline view shows that there are significant periods of time where the performance is unacceptable.
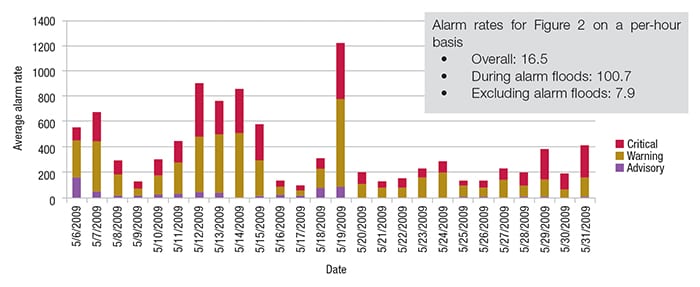
Figure 2. Timeline views of the data can reveal periods where alarm performance is not acceptable
Common contributors to an excessively high alarm rate include the following:
- The alarm system is being used to notify the operator of events that do not constitute actual alarms, such as communicating informational “for your information” messages, prompts, reminders or alerts.
- According to ISA-18.2, an “alarm” is an indication to the operator that an equipment malfunction, process deviation or abnormal condition requiring a timely response is occurring
- Chattering or other frequently occurring nuisance alarms are present. These often originate from non-process alarm sources of marginal interest to the operator, such as field devices or system hardware diagnostics. Chattering alarms can also indicate an incorrect alarm limit or deadband
- Redundant alarms, where multiple alarms are presented when a single abnormal situation occurs. An example is when a pump is shut down unexpectedly, generating a pump fail alarm in addition to alarms for low outlet flow and low discharge pressure
- A problem with the metric calculation is occurring. A correct calculation only counts new alarms presented to the particular operator or operating position for which the metric is intended, taking into consideration any by-design threshold settings or other authorized filtering mechanisms that cause fewer alarms to be presented to the operator than may be recorded in system event logs
Peak alarm rate
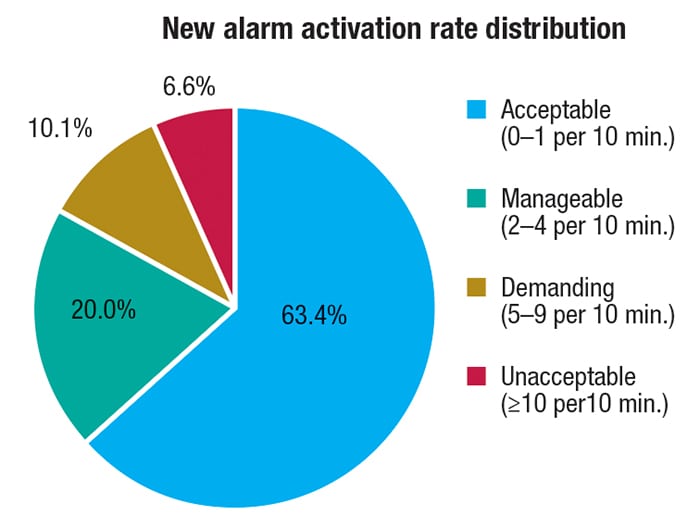
Figure 3. Pie charts can supplement alarm performance reports and give information on how much time is spent in the acceptable range
The two metrics — the percentage of 10-minute periods with more than 10 alarms, and the percent of time spent in an “alarm flood” state — are calculated differently, but are highly similar in that they quantify how much of the operator’s time is spent within the highly stressful circumstance of receiving more alarms than can be managed effectively.
EEMUA-191 defines the start of an alarm flood as a 10-minute period with more than 10 new alarms, continuing through subsequent 10-minute intervals until reaching a 10-minute interval with fewer than five new alarms. Equally acceptable is to define a flood simply as a 10-minute period with more than 10 new alarms. Often, an alarm-performance report will supplement these two metrics with a pie chart (Figure 3) that segments the report period into 10-minute periods that are categorized into named alarm-rate ranges, such as acceptable, manageable, demanding and unacceptable.
Another commonly included metric in the alarm-performance report, the peak number of alarms within a 10-minute period, is a straightforward measure of the degree of difficulty of the worst-case alarm flood for the operator. In poorly performing alarm systems, it is common to see peak alarm counts in a 10-minute period that exceed 250, a total that would overwhelm even the most highly skilled operator.
Common contributors to high peak-alarm-rate frequency and severity include the following items:
Multiple redundant alarms for the same abnormal condition. The optimum situation is of course that any single abnormal event will produce just one alarm, representing the best choice in terms of operator comprehension and the quickest path to take remedial action. This requires study of alarm causes and often leads to the design of conditional, first-out or other form of advanced alarming logic
Cascading alarms. The sudden shutdown of equipment often triggers automated actions of the control system, which in turn, triggers more alarms
False indications. When routine transitions between process states occur, the alarm system is not usually designed to “follow the process,” so it can therefore produce a multitude of false indications of an abnormal condition. Likewise, logic is typically required to detect state changes and suppress or modify alarms accordingly
Some systems provide specialized alarm views that present alarms in a graphical pattern to aid an operator’s comprehension of peak alarm events and their associated causality, supplementing the classic alarm list to help provide a built-in layer of defense against the overwhelming effects of an alarm flood.
Alarm priority distribution
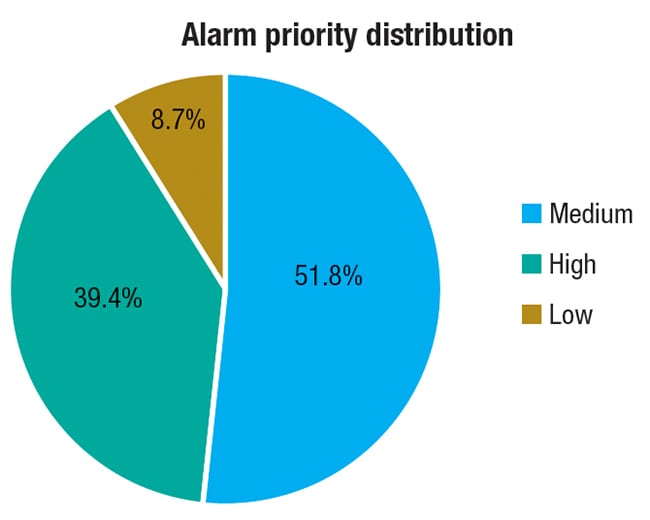
Figure 4. When the number of high-priority alarms exceeds that of low-priority alarms, the methodology of how alarms are assigned priority should be evaluated
When faced with multiple alarms, the operator must decide which to address first. This is — or should be — the basis for assigning priority to an alarm. Most systems will employ three or four priorities: low, medium, high and very-high. There are a number of well accepted methods for assigning priority, the most common being a systematic guided (selection-based) consideration of the severity of the consequence of inaction combined with the time available for the operator to take the required action. Conventional wisdom says that the annunciated alarm-priority distribution experienced by the operator for low-, medium- and high-priority alarms should be in an approximate ratio of 80, 15 and 5%. Ultimately however, the goal should be to guide the operator’s determination of the relative importance of one alarm compared to another, based on their importance to the business.
Figure 4 illustrates a situation where the number of high-priority (critical) alarms being presented to the operator far exceeds the low-priority (advisory) alarms, suggesting the need to review the consistency and methodology of the priority assignment.
Common contributors to out-of-balance alarm-priority distributions include the following:
- Alarm prioritization (a step in the rationalization process) has not been performed and alarm priorities have been left at their default values
- Misuse of the priority-setting scheme to classify alarms for reasons other than providing the operator with a tie-breaker during alarm peaks. For example, using priority to classify alarms by impact categories, such as environmental, product quality, safety/health, or economic loss
- Lack of discipline in setting priority based on consideration of direct (proximate) consequences rather than ultimate (unmitigated) consequences. While it may be the case that a designed operator action could fail, followed by a protective system failure, followed by a subsequent incorrect human response, such what-if considerations are likely to lead to a vast skewing of alarm priorities toward critical
Alarm source contribution
The percent of alarms coming from the top-ten most frequent alarm sources relative to the total alarm count is a highly useful metric for quantifying, identifying and ultimately weeding out nuisance alarms and alarm-system misuse. This is especially true if the alarm performance report covers a range of time where operations were routine and without significant process upsets or equipment failures. The top-ten alarm sources often provide “low-hanging” fruit for alarm-management performance improvement. They are a handful of alarms, which if addressed, will create a noticeable positive change for the operator.
Figure 5 shows a pattern observed in many control systems, where as few as ten alarm sources (like a control module or transmitter) out of the many thousands of defined alarm sources, collectively account for about 80% of all of the alarms presented to the operator. In this example, the first alarm source (FIST111) alone was responsible for 15% of all of the alarms presented to the operator.
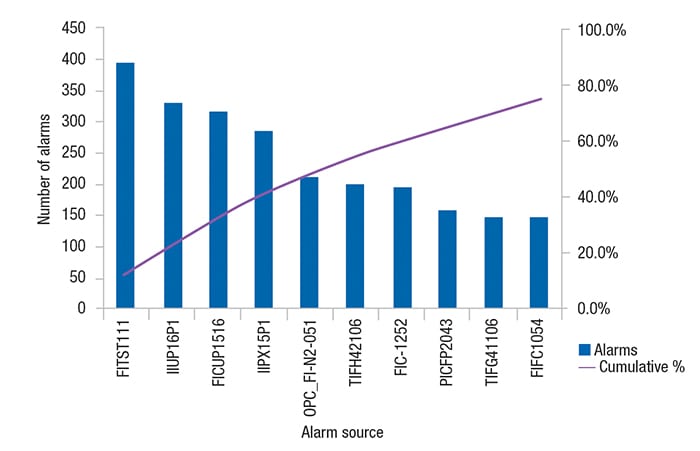
Figure 5. A small number of alarm sources can often account for the majority of alarms
Another related metric is the count of chattering alarms — alarms that repeatedly transition between the alarm state and the normal state in a short period of time. The specific criteria for identifying chattering alarms vary. The most common method is to count alarms that activate three or more times within one minute.
When the top-ten alarm sources generate over 20% of all the alarms presented to the operator, it is a strong indicator that one or both of the following is the case:
- Some of those alarms are nuisance alarms — alarms that operators have come to expect, and in most cases, ignore or consider to be informational
- The alarm system is being misused to (frequently) generate operator prompts based on routine changes in process conditions or operating states that may or may not require action
Eliminating chattering alarms is generally straightforward, using signal-conditioning features found in most control systems, such as on-delay, off-delay and hysteresis (deadband).
Stale alarms
A stale alarm is one that remains annunciated for an extended period of time, most often specified as 24 hours. Stale alarms are surprisingly challenging to quantify. Metrics based on event histories require the presence of both the start and ending alarm event in order to compute an alarm’s annunciated duration. There is no event representing the attainment of a certain age of an annunciated alarm. Thus, it is common to miss counting stale alarms if their activation event or all-clear event falls outside the range of dates and times covered in the event history. Consequently, there are alternate methods for quantifying stale alarms, such as periodic sampling of the active alarm lists at each operator workstation, or simply counting the number of alarms that attained an age greater than the threshold age. Given this variation in methods, it is important to exercise caution when comparing stale-alarm metrics across different sites that may be using different alarm-analytic applications.
In addition to being hard to quantify, stale alarms can also be some of the most difficult nuisance alarms to eliminate. Thus in some respects the upward or downward trend in stale alarm counts provides an informal indication of the overall ongoing health of the alarm management program.
Common contributors to stale alarm counts include the following:
- Routine transitions between process states where the alarm system is not designed to adapt and therefore provides false indications of an abnormal condition
- Alarms associated with standby or idle equipment
- Alarms configured to monitor conditions no longer relevant or available, an indicator of poor management-of-change processes
- Alarms that are essentially latched due to excessive application of hysteresis
- Alarms that persist beyond the called-for operator action, waiting for maintenance action. This likely constitutes an incorrect use of the alarm system, using it as a recording method for outstanding maintenance actions
In conjunction with reviewing the number of stale alarms or the list of stale alarms, it is also important to review what alarms have been manually suppressed (thus removing them from the view of the operator). Suppressing the alarm will remove a stale alarm from the alarm list (effectively reducing the number of stale alarms), but will not address the underlying condition.
Closing remarks
This article touches on just some of the key alarm-system performance metrics and what the numbers represent, in terms of the issues that lay behind them and possible actions to address them. With this understanding, periodic reviews of alarm-performance reports should lead to more focused actions that can improve operator effectiveness and thereby reduce the risks for economic loss, environmental damage or unsafe situations. For further reading on these and other alarm performance metrics, including suggested methods for corrective action, one outstanding resource is Ref. 4.
Edited by Scott Jenkins
References
1. EEMUA Publication 191 — Alarm Systems: A Guide to Design, Management and Procurement – Third edition, published by the Engineering Equipment and Materials Users Association in 2013.
2. ANSI/ISA–18.2–2009 — Management of Alarm Systems for the Process Industries – approved June 23, 2009. ISBN: 978-1-936007-19-6.
3. ANSI/ISA–18.2–2009 — Management of Alarm Systems for the Process Industries – approved June 23, 2009. ISBN: 978-1-936007-19-6.
4. International Society of Automation. Technical Report ISA-TRI 18.2.5, Alarm System Monitoring Assessment and Auditing, ISA. 2012.
Author
 Kim VanCamp is the DeltaV marketing product manager for alarm management at Emerson Process Management (8000 Norman Center Drive, Bloomington, MN 55437; Phone: 1-952-828-3500; Email: Kim.VanCamp@emerson.com). He joined Emerson in 1976 and has held senior assignments in manufacturing, technology, field service, customer service, service marketing and product marketing. VanCamp is a voting member of the ISA-18.2 committee on Management of Alarm Systems for the Process Industries and has published multiple papers on alarm management. He holds a bachelor’s degree in electrical engineering from the University of Nebraska.