Many engineers may wonder if it is possible to have flashing liquid flow in a control valve even if flow is not choked. The short answer is yes, but it is not very common. This article provides a more detailed answer to this question.
The basic liquid-sizing equation (Cv = Q √ G/ΔP) indicates that the liquid flowrate (Q) through a control valve is proportional to the square root of pressure drop (ΔP). However, this linear relationship does not always hold true. When the pressure drop is increased by lowering the downstream pressure, at some point, the flow no longer increases and the flow is considered choked.
This limiting or choking pressure drop is represented by ΔPchoked. If flow is choked, the result must be either cavitation or flashing. However, the inverse is not the case. That is, it is possible to have cavitation or flashing without choked flow. Furthermore, cavitation noise and damage often start before ΔP reaches ΔPchoked. Most valve manufacturers recognize this fact and use one of several methods to predict when cavitation noise and damage are likely to occur. But engineers may also wonder: is there the possibility of flashing before ΔP reaches ΔPchoked?
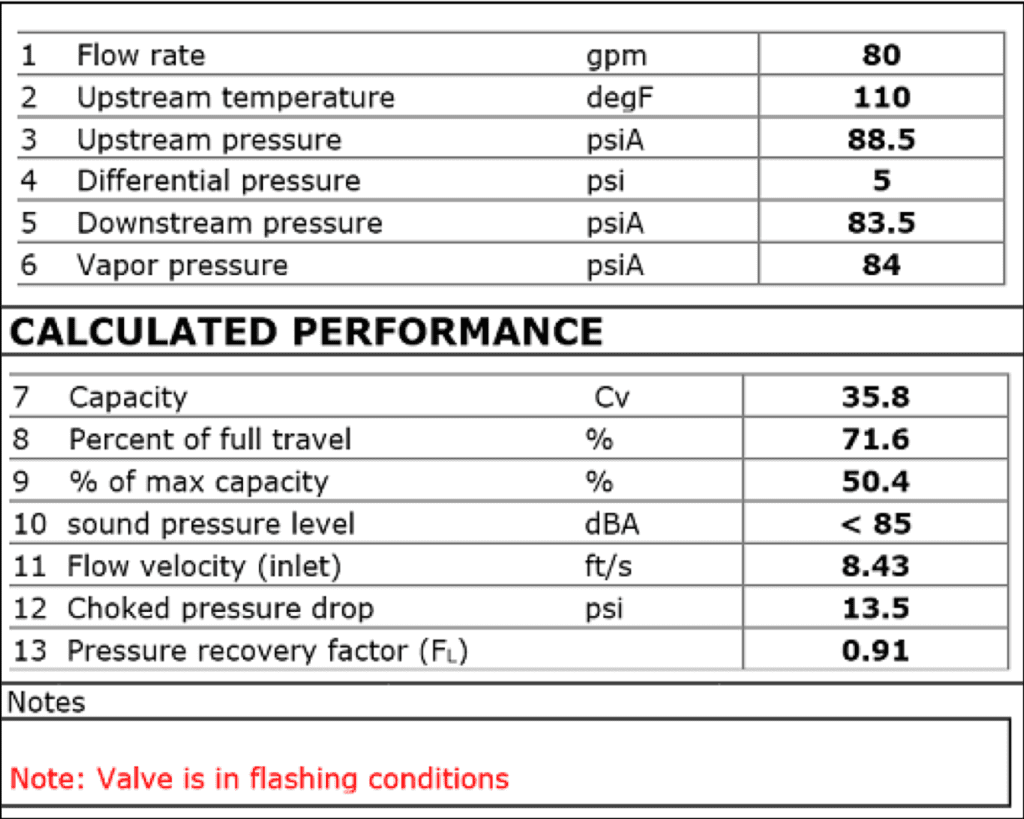
Figure 1. This control-valve sizing calculation sheet indicates flashing conditions without choked flow
Figure 1 is an example of a control-valve sizing datasheet that indicates flashing but not choked flow. There is a note stating that the valve will be in flashing conditions. The software that created Figure 1 states that “Valve is in flashing conditions” if the valve outlet pressure (P2) is less than the liquid’s vapor pressure. The fact that the downstream pressure on Line 5 (83.5 psia) is less than the liquid’s vapor pressure on Line 6 (84 psia) tells us that the fluid exiting the valve will be flashing. However, on Line 12, the choked pressure drop is 13.5 psi, indicating that the pressure drop across the valve must be at least 13.5 psi for flow to be choked. However, the actual pressure drop across the valve (Line 4) is only 5 psi. This means that flow will not be choked. To summarize, the sizing calculation tells us that we will have flashing, but not choked flow.
To rectify these findings, the author developed a series of calculations based on the data in Figure 1 (see Figure 2) and then formulated a graph representing these calculations in graphical form (see Figure 3). examining Figures 2 and 3, it can be concluded that flow is indeed not choked and any “flashing” (or vaporization) that takes place begins with vaporization of the liquid after it has passed through the vena contracta (the area of the system with the smallest diameter). It is the conditions at the vena contracta that determine the rate of flow through a valve, and if vaporization is to cause flow to choke, it must happen at the vena contracta. Downstream of the vena contracta, a largely vapor fluid would have to reach sonic velocity somewhere downstream before flow would choke.
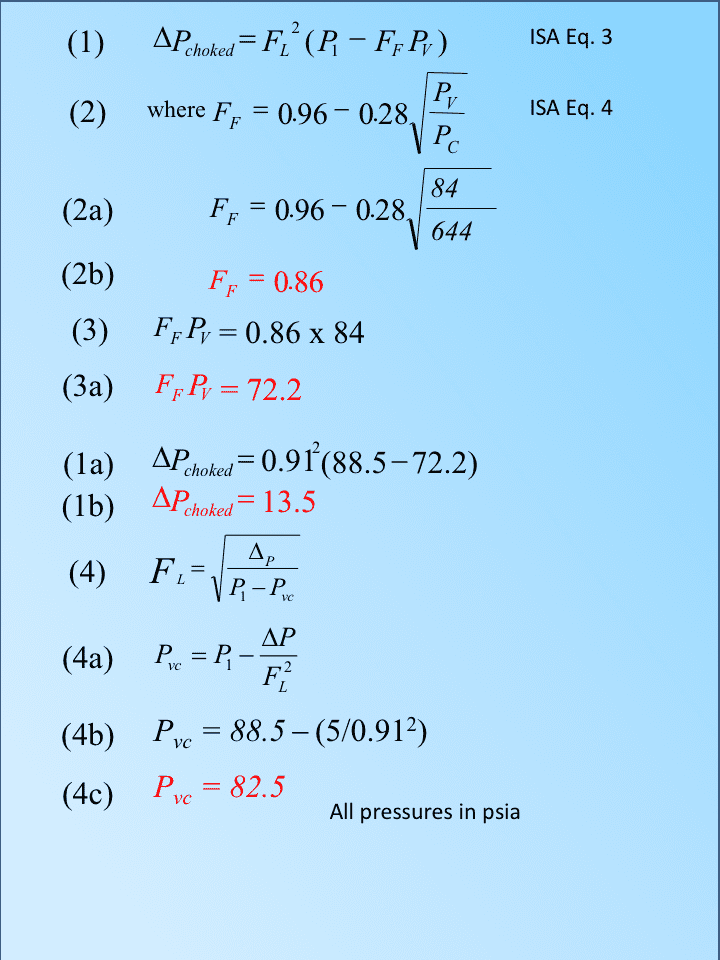
Figure 2. These control-valve sizing calculations indicate flashing conditions without choked flow
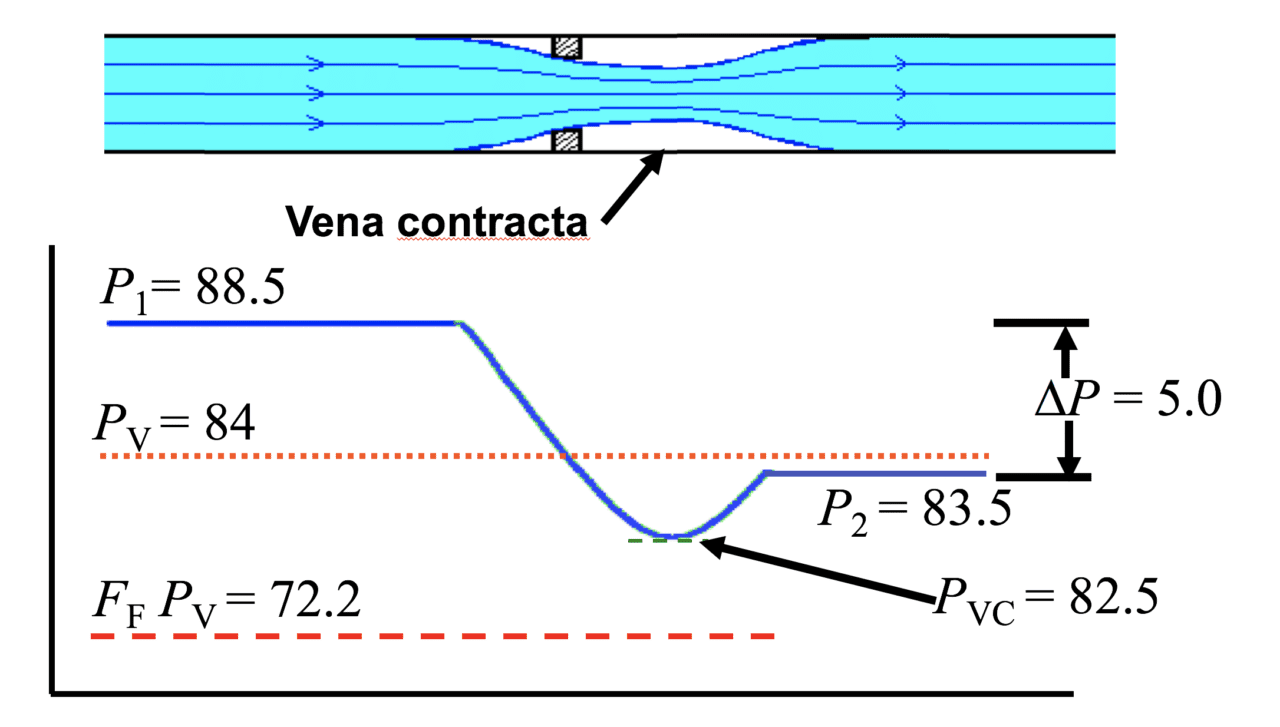
Figure 3. This chart shows the graphical representation of the results of the calculations in Figure 2
In Figure 2, Lines 1 and 2 are Equations 3 and 4 in the Valve Sizing Equation Standard from the International Society of Automation (ISA; Research Triangle Park, N.C.; www.isa.org). Line 1 calculates ΔPchoked (the pressure drop at which liquid flow through a control valve will choke). Because any particularly small volume of the liquid is only in the vena contracta for a very short time, experiments have determined that liquid in the vena contracta will not vaporize when its local pressure decreases to the vapor pressure of the liquid. However, for vaporization to occur, the pressure at the vena contracta must drop to slightly below the vapor pressure. An approximation of how much below the vapor pressure the vena contracta pressure must fall for vaporization is included in the ISA standard as the Critical Pressure Ratio Factor (FF) (ISA Equation 4), and this is repeated on Line 2, where PC is the thermodynamic critical pressure of the liquid. When the pressure at the vena contracta drops to the vapor pressure, Pv, multiplied by FF, flow will choke. Calculated values of FF can range between 0.68 and 0.96, depending on the ratio of vapor pressure to critical pressure.
Lines 2a and 2b show calculation of the value of FF for this application, which is 0.86.
Lines 3 and 3a calculate the value of FFPV to be used in the equation on Line 1.
Lines 1a and 1b, calculate ΔPchoked to be 13.5 psia, which agrees exactly with Line 12 of the computerized sizing calculation in Figure 1.
Line 4 is the commonly accepted definition of the Liquid Pressure Recovery Factor (FL ).
Line 4a is the equation on Line 4 rearranged to solve for Pvc, the pressure at the vena contracta. Note that this equation is only valid if the fluid at the vena contracta is not vaporizing.
Lines 4b and 4c calculate that the pressure at the vena contracta will be 82.5 psia when the process conditions are at the given values of P1 = 88.5 psia (Line 3 of the Figure 1), the differential pressure = 5 psi, (Line 4 of Figure 1) and the FL = 0.91 from Line 9 of Figure 1.
On the graphical representation in Figure 3, the blue curve represents the pressure profile within the valve and shows where P1, P2, Pv, FFPV and Pvc are located in relation to the pressure profile.
The pressure profile behaves as expected; pressure drops to a minimum at the vena contracta. Beyond the vena contracta, pressure recovers to the valve’s specified outlet pressure. The pressure drops below the upstream vapor pressure at the vena contracta, but not to FFPV, so there is no vaporization at the vena contracta. Therefore, there is no choked flow at the vena contracta and no vapor in the flow leaving the vena contracta. At some point beyond the vena contracta, the liquid will be exposed to a surrounding pressure equal to or less than its vapor pressure for a long enough time to cause it to begin vaporizing or “flashing.”
All of the above discussion is based on the ISA valve sizing equation standard (ISA 75), which at this time presents the only accepted set of formulas for sizing control valves.
In conclusion, if one accepts the ISA calculation methods for choked flow, which have been in use for several decades, it is possible to have process conditions where liquid flow in a control valve is flashing, but flow is not choked.
For readers in parts of the world that rely on standards from the International Electrotechnical Commission (IEC; Geneva, Switzerland; www.iec.ch) rather than on ISA standards, it is fortunate that both the ISA and IEC control valve sizing equation standards are technically identical, and engineers would get the results mentioned in this article using either.
Edited by Mary Page Bailey
Author

Jon Monsen is a control valve technology specialist with Valin Corp. (Email; jmonsen@valin.com; Website: https://www.valin.com). He has provided control-valve expertise at Valin for over 15 years and has over 35 years of experience working in industry. He has lectured nationally and internationally on control valve application and sizing, and is the author of the chapter on “Computerized Control Valve Sizing” in the ISA Practical Guides book on Control Valves.